

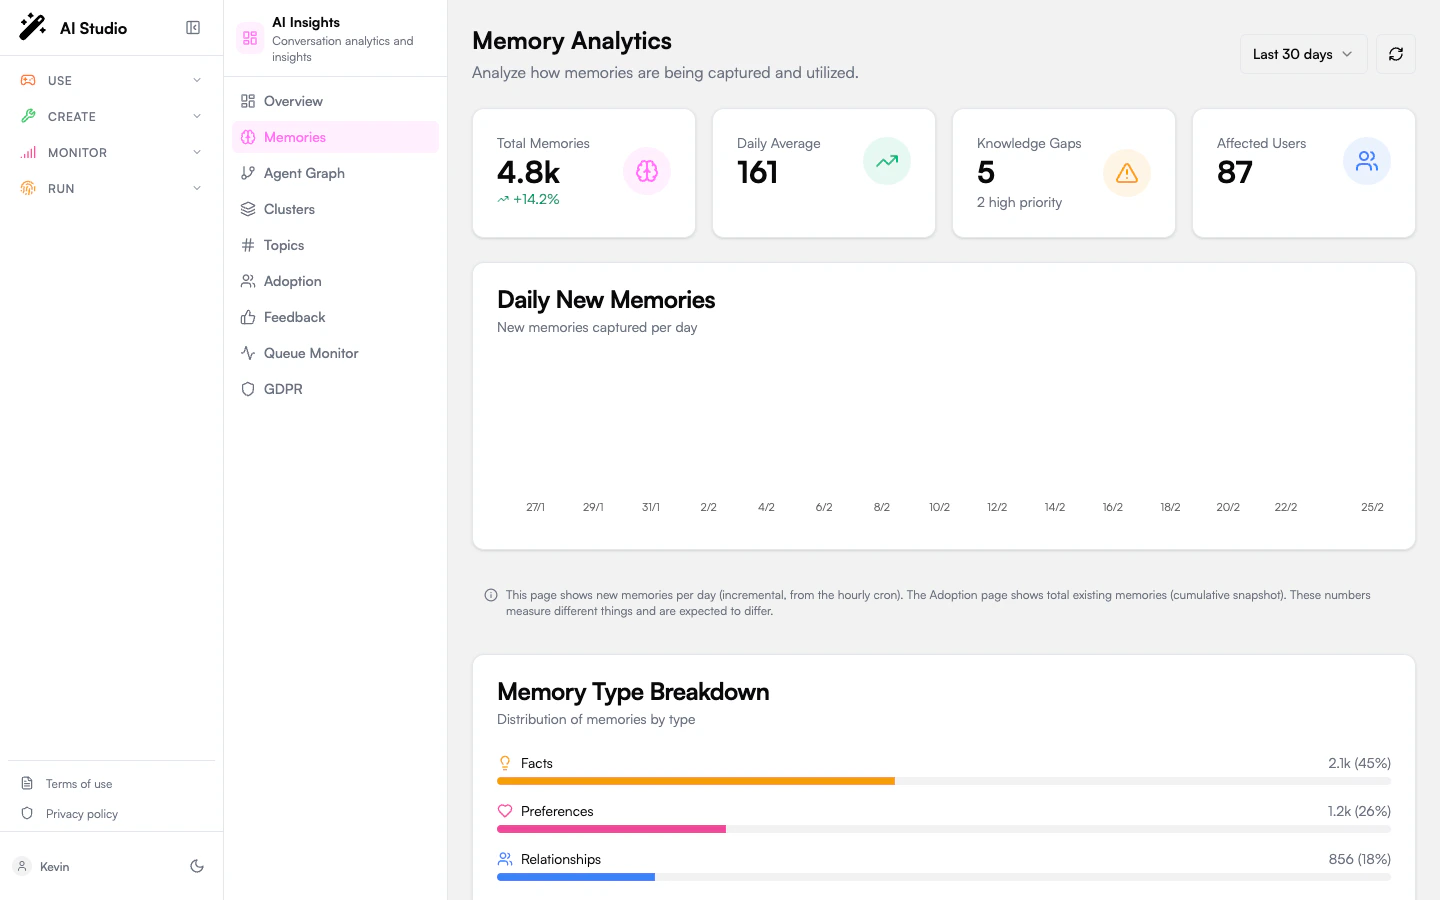
Period selector
A7d / 30d / 90d selector in the top-right scopes every chart and KPI on the page. The default is 30 days.
A refresh button next to it forces a re-fetch of the analytics.
KPIs
Daily new memories chart
A bar chart showing how many memories were captured each day in the period. Use it to spot bursts (a feature launch, an incident) and lulls (an outage, a holiday).Type breakdown
Memories are tagged with a type by the capture pipeline:
The breakdown shows count and percentage per type, plotted as horizontal bars.
Knowledge gaps
A gap is a topic users asked about repeatedly that the agent doesn’t yet have a memory for. Each gap card shows:- The topic name and a severity badge (high, medium, low).
- The number of occurrences and the number of distinct users affected.
- Up to five extracted keywords.
- A suggested action — usually “add a knowledge base entry covering X” or “extend the agent’s instructions with Y”.
Recommendations
A standalone card at the bottom lists priority-ordered actions the analytics pipeline derived from the gaps and the type distribution. Each entry has a priority badge (high / medium / low) and a short action string. These are advisory — the platform doesn’t apply them automatically.Where to go next
See memories grouped by topic
Drill into specific topics, examples, and trend direction.
Read user adoption signals
Personalization depth as part of the adoption picture.