

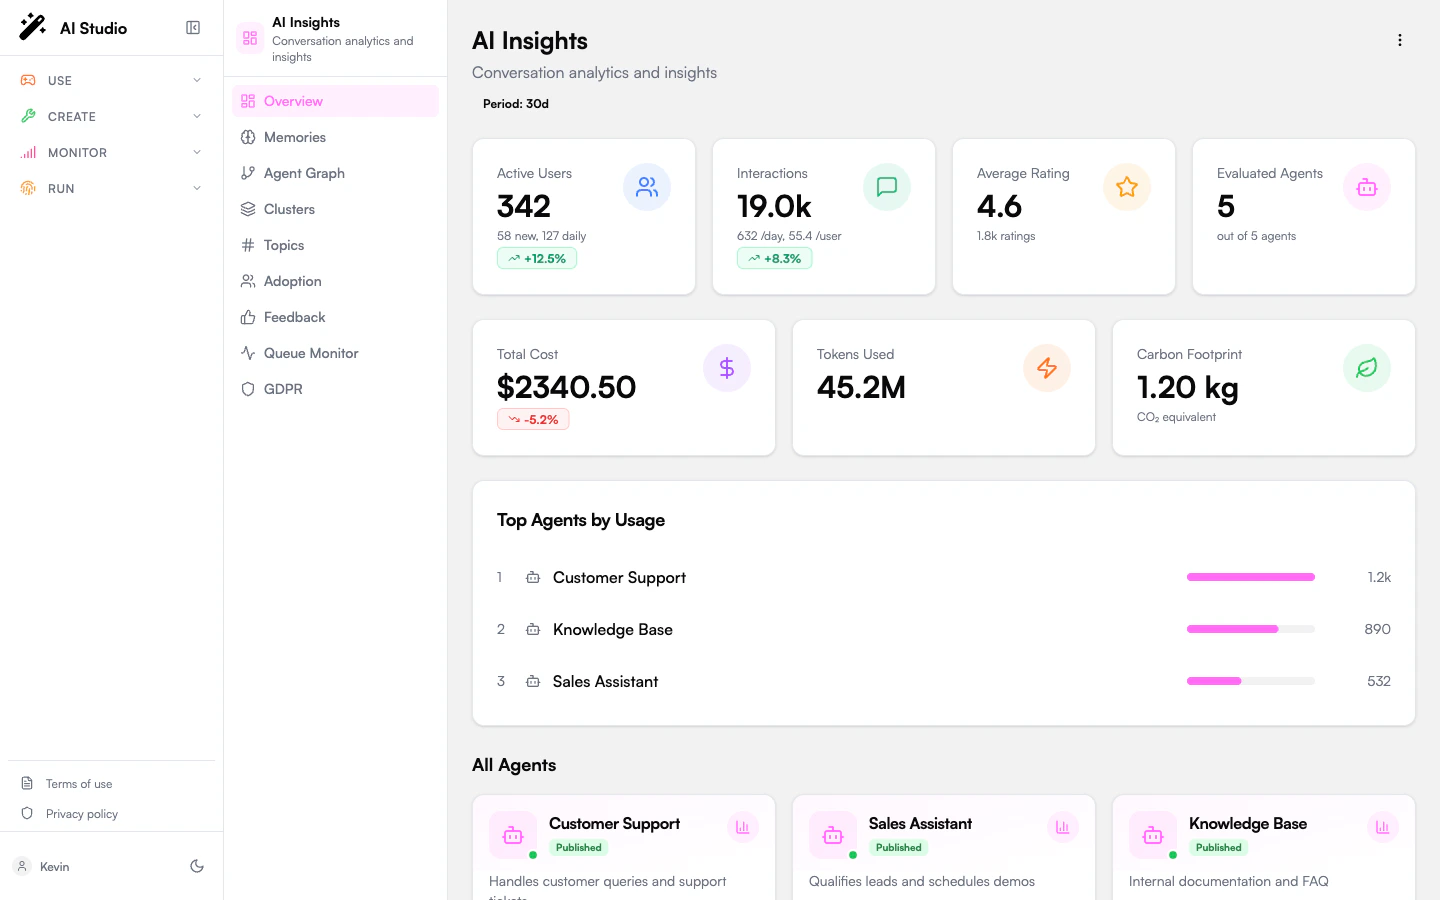
At a glance
The page has four blocks, top to bottom:- Header with the dashboard period badge and a three-dot menu.
- Primary KPIs — Active Users, Interactions, Average Rating, Evaluated Agents.
- Secondary KPIs — Total Cost, Tokens Used, Carbon Footprint.
- Top Agents by Usage ranked list and the All Agents grid.
The KPIs explained
Active Users
Active Users
Distinct users who interacted with at least one agent in the period. The card also shows the new users added in the period and the daily active count, plus a trend badge against the previous period of the same length.
Interactions
Interactions
Total user-agent interactions in the period. The card breaks it down to per-day and per-user averages, with a trend badge.
Average Rating
Average Rating
The average user rating across all rated conversations, plus the total count of ratings. A dash (
-) means no ratings have been collected yet.Evaluated Agents
Evaluated Agents
Number of agents that have at least one analyzed conversation, over the total number of published agents. A low ratio means most of your fleet is not being evaluated — likely because the agents are too new or because analysis hasn’t run yet.
Total Cost
Total Cost
Aggregate model spend in the period (USD). Trends against the previous period.
Tokens Used
Tokens Used
Total input + output tokens across all agents in the period.
Carbon Footprint
Carbon Footprint
Estimated CO₂-equivalent emissions for the period in kg, derived from the model usage.
Top Agents by Usage
The five agents with the highest interaction count, with a horizontal bar showing each agent’s share of the leader’s volume. Click a row to jump straight into that agent’s per-agent overview.All Agents
A grid of every published agent your account can see. Each card surfaces the agent’s name, category, and a quick read on its analyzed volume and average score. Click any card to enter the agent view.Recalculate metrics
The KPIs on this page are computed from a daily aggregation. After a large bulk analysis run, the dashboard may show stale numbers until the next aggregation cycle. The three-dot menu in the top-right exposes Recalculate metrics — use it to force the rollup immediately. The action requires platform-admin authentication (verified through Governe). Without that role the request is rejected at the API layer.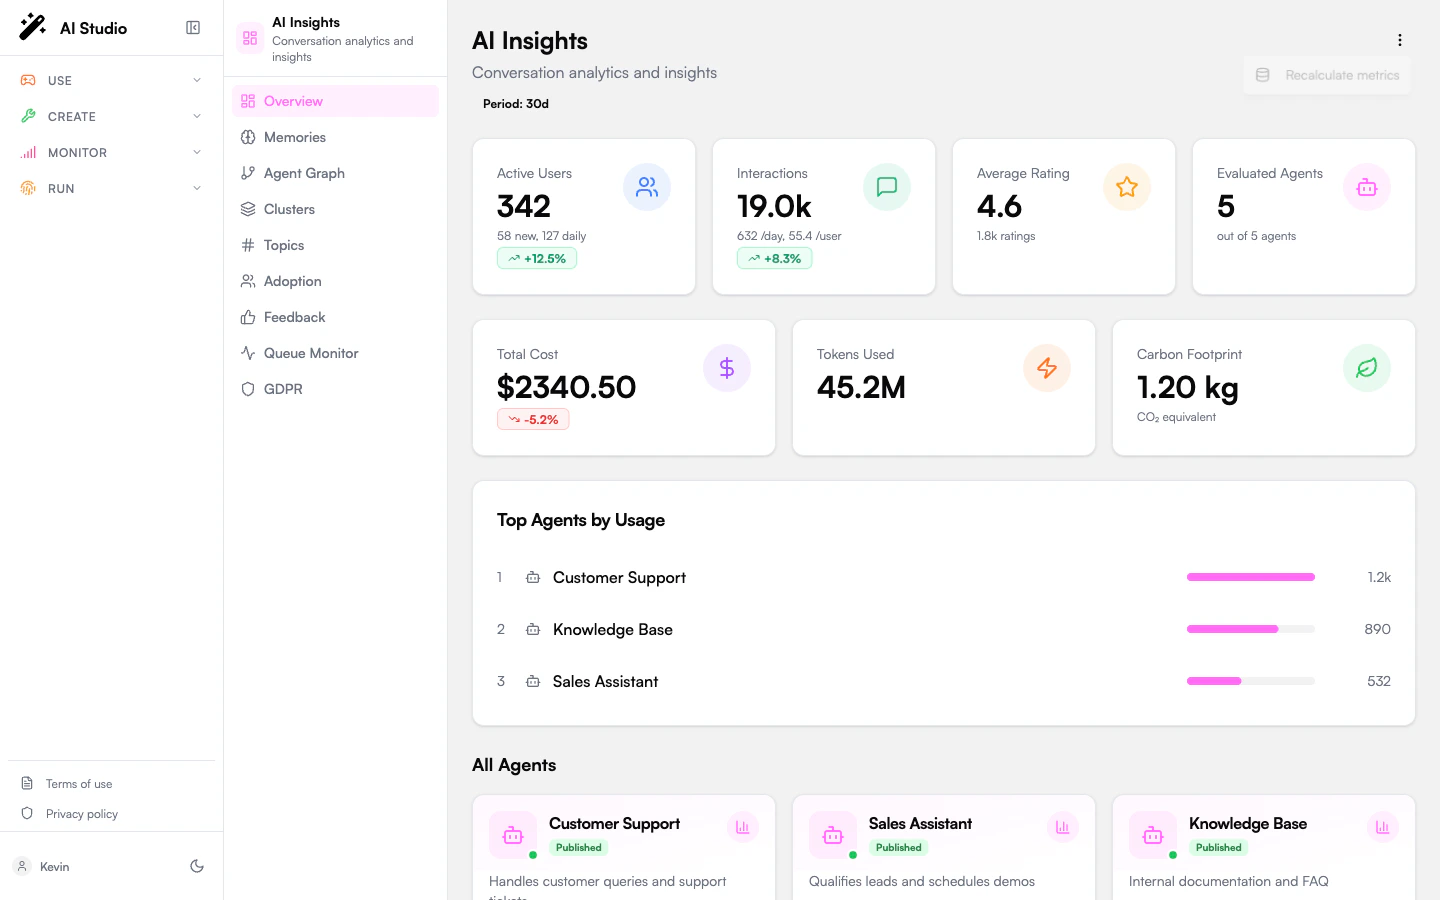
What this dashboard doesn’t show
- Per-agent quality detail. Use Agent overview instead.
- User feedback. Likes, dislikes, and dislike categories live on Feedback.
- Adoption segmentation. Power / Regular / Basic users live on Adoption.
- Memory and topic trends. See Memories and Topics.
Where to go next
Drill into one agent
Click any agent card to enter its scoped view.
Visualize the fleet
See agents, tools, and categories as an interactive network.