> ## Documentation Index
> Fetch the complete documentation index at: https://docs.prisme.ai/llms.txt
> Use this file to discover all available pages before exploring further.
# Analysis queue
> Real-time stats for the analysis pipeline — depth, throughput, and health.
The **Queue Monitor** entry in the organization sidebar is the operational view of the analysis pipeline. Every conversation that gets analyzed flows through a queue with a worker pool, a daily budget, and rate limits. This page tells you whether the pipeline is keeping up.
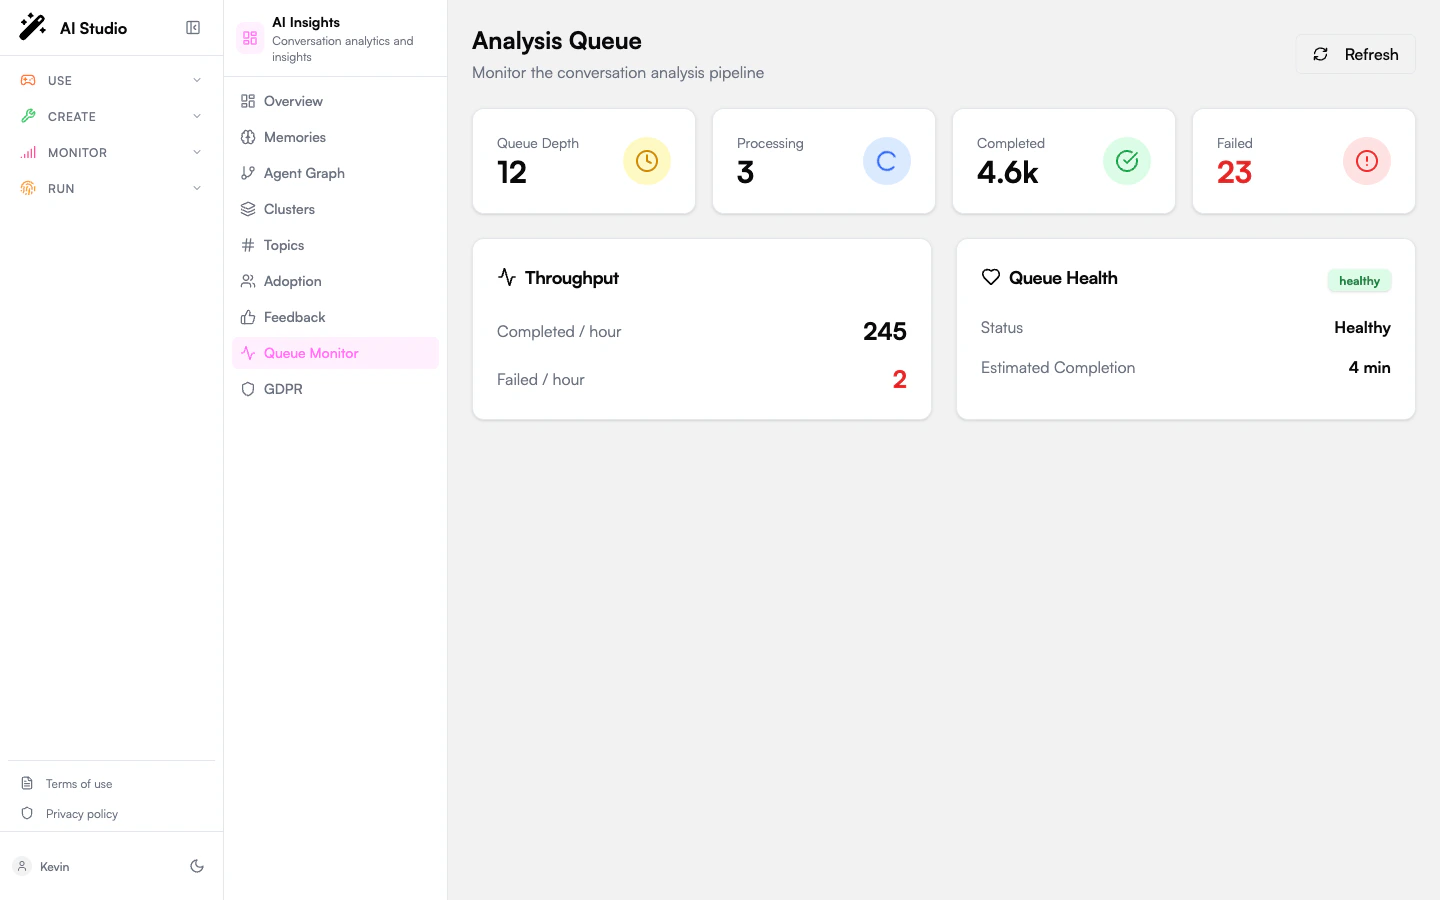 ## KPI cards
Four cards summarizing queue state right now:
| Card | Meaning |
| --------------- | ---------------------------------------------------------------------------------------------------------- |
| **Queue Depth** | Conversations currently waiting to be analyzed (Pending). A growing depth means the workers can't keep up. |
| **Processing** | Conversations currently being analyzed. Bounded by the worker pool size. |
| **Completed** | Total conversations the pipeline finished successfully (lifetime counter for the period). |
| **Failed** | Total conversations that failed analysis. Shown in red so it stands out. |
## Throughput
A card showing rate metrics:
| Metric | Meaning |
| ---------------------- | -------------------------------------------------------------- |
| **Completed Per Hour** | Successful analyses per hour, averaged over the recent window. |
| **Failed Per Hour** | Failures per hour. |
Use throughput to project when a backlog will clear. If Queue Depth is 5,000 and Completed Per Hour is 600, you have roughly 8 hours of work ahead — assuming no new conversations arrive in the meantime.
## Queue Health
A status badge plus an estimated completion time:
| Status | Meaning |
| -------------- | --------------------------------------------------------------------------------------------------------------------- |
| **healthy** | Workers are keeping pace with incoming work. |
| **busy** | Depth is non-trivial but throughput is sufficient. |
| **backlogged** | Depth is growing faster than throughput. Consider rate-limiting new analyses or raising the workspace's daily budget. |
**Estimated Completion** shows how long until the current backlog clears at the current throughput. Displayed in minutes for short backlogs, hours for longer ones, or *Unknown* when throughput is zero.
A **Refresh** button at the top of the page forces a re-fetch — the page doesn't poll automatically.
## Why analyses fail
Common failure modes that drive the **Failed** counter:
* **Conversation not found.** The original conversation was deleted between queue and analyze, or the agent ID is invalid.
* **Model rate limit / timeout.** The analysis LLM was unavailable. The pipeline retries up to 3 times before marking the conversation as failed.
* **Malformed criteria.** A criterion question or option list that the LLM can't reliably answer.
* **Quota exhausted.** Daily analysis budget reached.
You can retry a single failed conversation from [Conversations](/products/ai-insights/conversations) using the **Re-analyze** button. To retry many at once, batch-select the rows under the **Failed** filter and click **Analyze Selected**.
## Where to go next
Browse conversations and analyze them, batch-select to clear backlog.
## KPI cards
Four cards summarizing queue state right now:
| Card | Meaning |
| --------------- | ---------------------------------------------------------------------------------------------------------- |
| **Queue Depth** | Conversations currently waiting to be analyzed (Pending). A growing depth means the workers can't keep up. |
| **Processing** | Conversations currently being analyzed. Bounded by the worker pool size. |
| **Completed** | Total conversations the pipeline finished successfully (lifetime counter for the period). |
| **Failed** | Total conversations that failed analysis. Shown in red so it stands out. |
## Throughput
A card showing rate metrics:
| Metric | Meaning |
| ---------------------- | -------------------------------------------------------------- |
| **Completed Per Hour** | Successful analyses per hour, averaged over the recent window. |
| **Failed Per Hour** | Failures per hour. |
Use throughput to project when a backlog will clear. If Queue Depth is 5,000 and Completed Per Hour is 600, you have roughly 8 hours of work ahead — assuming no new conversations arrive in the meantime.
## Queue Health
A status badge plus an estimated completion time:
| Status | Meaning |
| -------------- | --------------------------------------------------------------------------------------------------------------------- |
| **healthy** | Workers are keeping pace with incoming work. |
| **busy** | Depth is non-trivial but throughput is sufficient. |
| **backlogged** | Depth is growing faster than throughput. Consider rate-limiting new analyses or raising the workspace's daily budget. |
**Estimated Completion** shows how long until the current backlog clears at the current throughput. Displayed in minutes for short backlogs, hours for longer ones, or *Unknown* when throughput is zero.
A **Refresh** button at the top of the page forces a re-fetch — the page doesn't poll automatically.
## Why analyses fail
Common failure modes that drive the **Failed** counter:
* **Conversation not found.** The original conversation was deleted between queue and analyze, or the agent ID is invalid.
* **Model rate limit / timeout.** The analysis LLM was unavailable. The pipeline retries up to 3 times before marking the conversation as failed.
* **Malformed criteria.** A criterion question or option list that the LLM can't reliably answer.
* **Quota exhausted.** Daily analysis budget reached.
You can retry a single failed conversation from [Conversations](/products/ai-insights/conversations) using the **Re-analyze** button. To retry many at once, batch-select the rows under the **Failed** filter and click **Analyze Selected**.
## Where to go next
Browse conversations and analyze them, batch-select to clear backlog.