> ## Documentation Index
> Fetch the complete documentation index at: https://docs.prisme.ai/llms.txt
> Use this file to discover all available pages before exploring further.
# Agent network
> Interactive network of agents, tools, and categories with similarity, delegation, and tool-usage relationships.
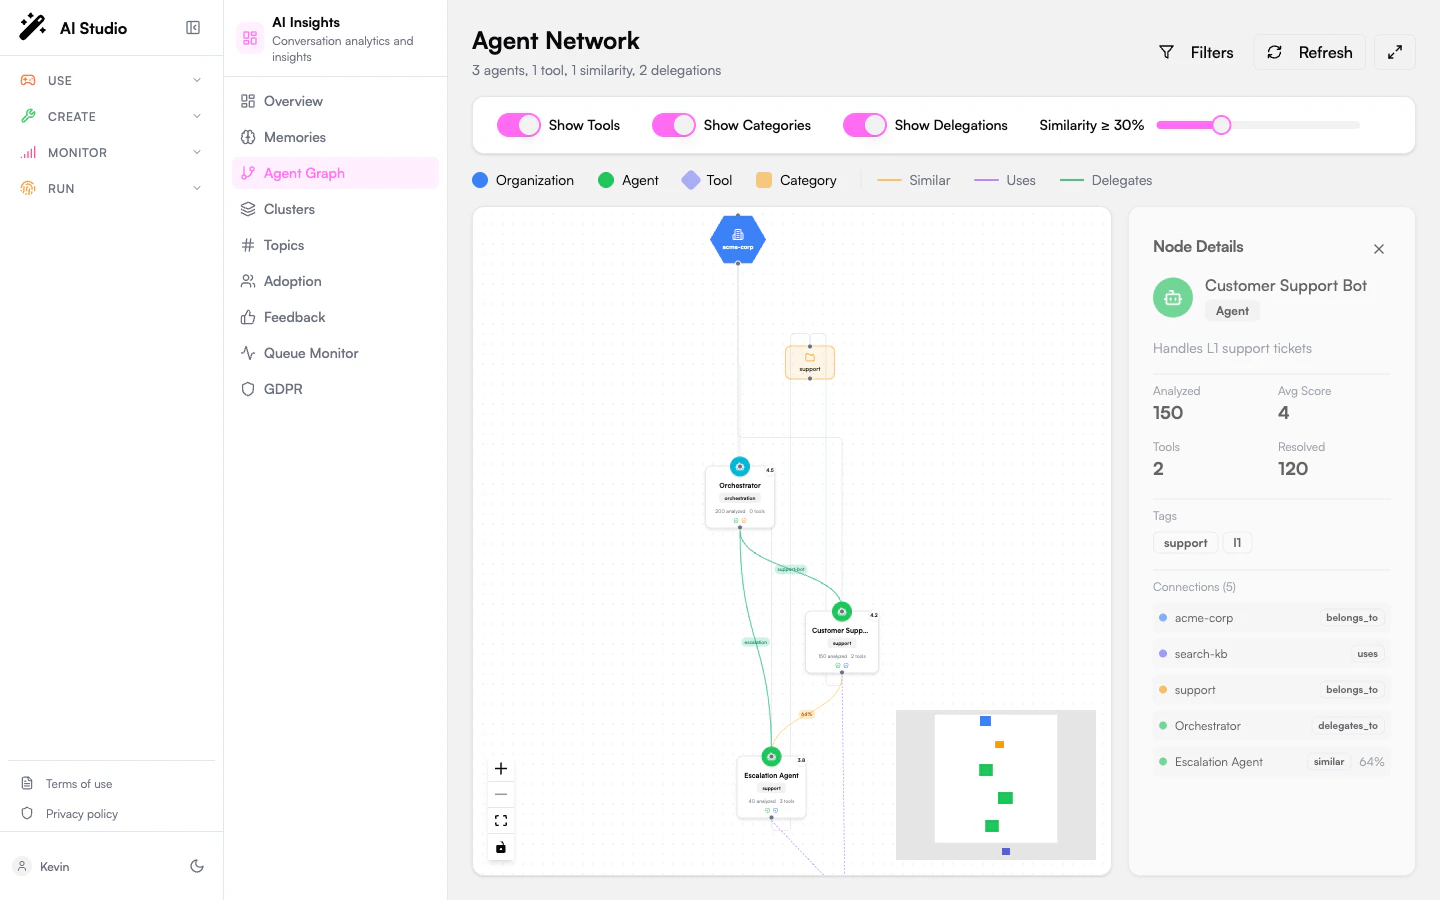
The **Agent Graph** entry in the organization sidebar is an interactive map of your agent fleet — agents, the tools they use, the categories they belong to, and their similarity and delegation links.
 ## What the graph shows
Four node types and three edge types:
| Element | Visual | What it represents |
| ---------------- | ------------------ | ---------------------------------------------------------------------------------------- |
| **Organization** | Blue circle | Your tenant — the root of the network. |
| **Agent** | Green circle | A published agent in Agent Creator. |
| **Tool** | Indigo diamond | A tool used by one or more agents. |
| **Category** | Amber square | An agent category (taxonomy). |
| **Similar** | Amber line | Two agents whose conversation patterns and tools overlap above the similarity threshold. |
| **Uses** | Purple dashed line | An agent that calls a tool. |
| **Delegates** | Emerald line | An agent that hands off to another agent. |
Layout is computed automatically with a layered ELK algorithm — you don't need to position nodes manually.
## Header controls
The top bar shows a one-line summary — *"X agents, Y tools, Z similarities, W delegations"* — and three buttons:
* **Filters** — toggles the filter panel below.
* **Refresh** — re-fetches the graph data.
* **Expand / Collapse** — fullscreen mode. The minimap is hidden in fullscreen.
## Filters
Open the filter panel with the **Filters** button. Three on/off toggles plus a slider:
| Filter | Effect |
| -------------------- | -------------------------------------------------------------------------------------------------------------------------- |
| **Show Tools** | Toggle Tool nodes and the **Uses** edges. |
| **Show Categories** | Toggle Category nodes (and any edges leading to them). |
| **Show Delegations** | Toggle the **Delegates** edges. |
| **Similarity ≥ X%** | Hide **Similar** edges below the threshold. Defaults to a moderate value — drag higher to keep only the strongest matches. |
## Node details panel
Click any node to load its details on the right:
* The node's name, type, and description.
* For agents: a metric grid — analyzed conversations, average score, tool count, resolved count.
* A list of tags.
* A **Connections** list with every node directly linked to this one. Click any item to jump focus to that node.
Without a selection, the panel shows a "Select a Node" placeholder with a hint to drag-pan and scroll-zoom.
## Canvas controls
Standard ReactFlow controls, on the canvas itself:
* **Drag** any blank area to pan.
* **Scroll** to zoom.
* **Drag** a node to reposition it manually (the layout doesn't auto-rerun).
* **Click** to select a node and load its details.
* **Right-click** a node for the context menu (where applicable).
A minimap is shown in the bottom corner when not in fullscreen.
## Empty and error states
| State | Cause | What to do |
| ------------------------- | --------------------------------------------------------------------- | ---------------------------------------------------------------- |
| **No Graph Data** | The org has no published agents yet. | Create agents in Agent Creator. |
| **Graph Component Error** | The graph rendering library failed to load — usually a network issue. | Refresh the page, check console, contact support if it persists. |
## What to use this for
* **Spot duplicate agents.** Two agents on a thick **Similar** edge are doing almost the same thing — consider merging.
* **Find orphans.** Agents with very few connections often signal agents nobody is using.
* **Audit tool sprawl.** Tools with very high fan-in are critical infrastructure; a tool used by only one agent might be a candidate for deletion.
* **Map delegation chains.** Long delegation chains can introduce latency and ambiguity — flatten them where possible.
## Where to go next
The same similarity signal, grouped into named clusters.
Click any agent node to drill into its scoped view.
## What the graph shows
Four node types and three edge types:
| Element | Visual | What it represents |
| ---------------- | ------------------ | ---------------------------------------------------------------------------------------- |
| **Organization** | Blue circle | Your tenant — the root of the network. |
| **Agent** | Green circle | A published agent in Agent Creator. |
| **Tool** | Indigo diamond | A tool used by one or more agents. |
| **Category** | Amber square | An agent category (taxonomy). |
| **Similar** | Amber line | Two agents whose conversation patterns and tools overlap above the similarity threshold. |
| **Uses** | Purple dashed line | An agent that calls a tool. |
| **Delegates** | Emerald line | An agent that hands off to another agent. |
Layout is computed automatically with a layered ELK algorithm — you don't need to position nodes manually.
## Header controls
The top bar shows a one-line summary — *"X agents, Y tools, Z similarities, W delegations"* — and three buttons:
* **Filters** — toggles the filter panel below.
* **Refresh** — re-fetches the graph data.
* **Expand / Collapse** — fullscreen mode. The minimap is hidden in fullscreen.
## Filters
Open the filter panel with the **Filters** button. Three on/off toggles plus a slider:
| Filter | Effect |
| -------------------- | -------------------------------------------------------------------------------------------------------------------------- |
| **Show Tools** | Toggle Tool nodes and the **Uses** edges. |
| **Show Categories** | Toggle Category nodes (and any edges leading to them). |
| **Show Delegations** | Toggle the **Delegates** edges. |
| **Similarity ≥ X%** | Hide **Similar** edges below the threshold. Defaults to a moderate value — drag higher to keep only the strongest matches. |
## Node details panel
Click any node to load its details on the right:
* The node's name, type, and description.
* For agents: a metric grid — analyzed conversations, average score, tool count, resolved count.
* A list of tags.
* A **Connections** list with every node directly linked to this one. Click any item to jump focus to that node.
Without a selection, the panel shows a "Select a Node" placeholder with a hint to drag-pan and scroll-zoom.
## Canvas controls
Standard ReactFlow controls, on the canvas itself:
* **Drag** any blank area to pan.
* **Scroll** to zoom.
* **Drag** a node to reposition it manually (the layout doesn't auto-rerun).
* **Click** to select a node and load its details.
* **Right-click** a node for the context menu (where applicable).
A minimap is shown in the bottom corner when not in fullscreen.
## Empty and error states
| State | Cause | What to do |
| ------------------------- | --------------------------------------------------------------------- | ---------------------------------------------------------------- |
| **No Graph Data** | The org has no published agents yet. | Create agents in Agent Creator. |
| **Graph Component Error** | The graph rendering library failed to load — usually a network issue. | Refresh the page, check console, contact support if it persists. |
## What to use this for
* **Spot duplicate agents.** Two agents on a thick **Similar** edge are doing almost the same thing — consider merging.
* **Find orphans.** Agents with very few connections often signal agents nobody is using.
* **Audit tool sprawl.** Tools with very high fan-in are critical infrastructure; a tool used by only one agent might be a candidate for deletion.
* **Map delegation chains.** Long delegation chains can introduce latency and ambiguity — flatten them where possible.
## Where to go next
The same similarity signal, grouped into named clusters.
Click any agent node to drill into its scoped view.