> ## Documentation Index
> Fetch the complete documentation index at: https://docs.prisme.ai/llms.txt
> Use this file to discover all available pages before exploring further.
# Organization dashboard
> The default landing view in Insights — KPIs and a ranked list of every agent in your organization.
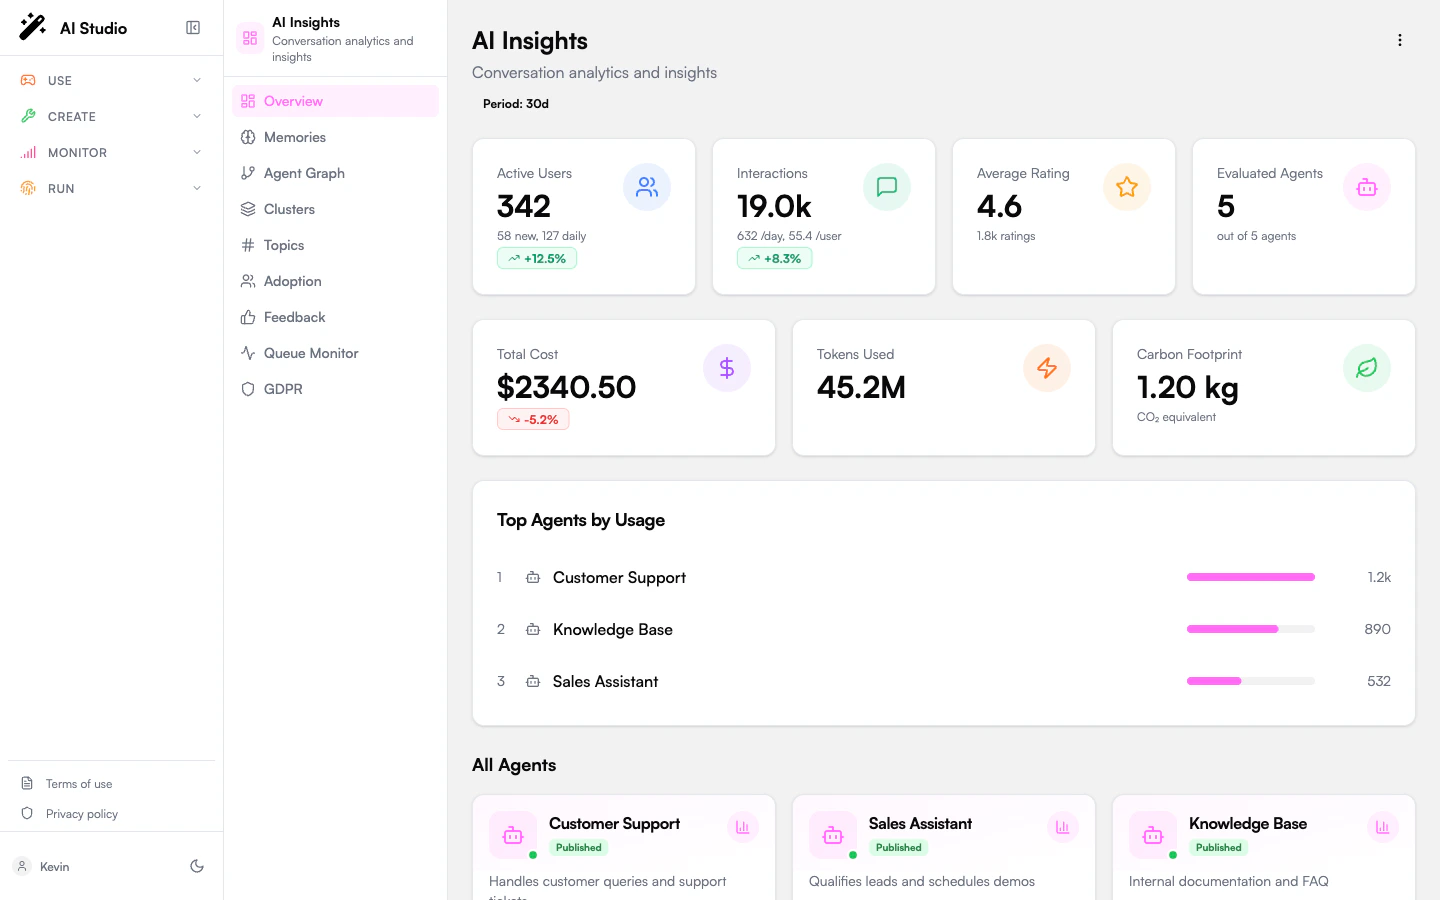
The Organization dashboard is the **Overview** entry in the sidebar at the organization level. It rolls every agent in the org into a single fleet-level read.
 ## At a glance
The page has four blocks, top to bottom:
1. **Header** with the dashboard period badge and a three-dot menu.
2. **Primary KPIs** — Active Users, Interactions, Average Rating, Evaluated Agents.
3. **Secondary KPIs** — Total Cost, Tokens Used, Carbon Footprint.
4. **Top Agents by Usage** ranked list and the **All Agents** grid.
## The KPIs explained
Distinct users who interacted with at least one agent in the period. The card also shows the **new** users added in the period and the **daily** active count, plus a trend badge against the previous period of the same length.
Total user-agent interactions in the period. The card breaks it down to per-day and per-user averages, with a trend badge.
The average user rating across all rated conversations, plus the total count of ratings. A dash (`-`) means no ratings have been collected yet.
Number of agents that have at least one analyzed conversation, over the total number of published agents. A low ratio means most of your fleet is not being evaluated — likely because the agents are too new or because analysis hasn't run yet.
Aggregate model spend in the period (USD). Trends against the previous period.
Total input + output tokens across all agents in the period.
Estimated CO₂-equivalent emissions for the period in kg, derived from the model usage.
## Top Agents by Usage
The five agents with the highest interaction count, with a horizontal bar showing each agent's share of the leader's volume. Click a row to jump straight into that agent's per-agent overview.
## All Agents
A grid of every published agent your account can see. Each card surfaces the agent's name, category, and a quick read on its analyzed volume and average score. Click any card to enter the agent view.
## Recalculate metrics
The KPIs on this page are computed from a daily aggregation. After a large bulk analysis run, the dashboard may show stale numbers until the next aggregation cycle.
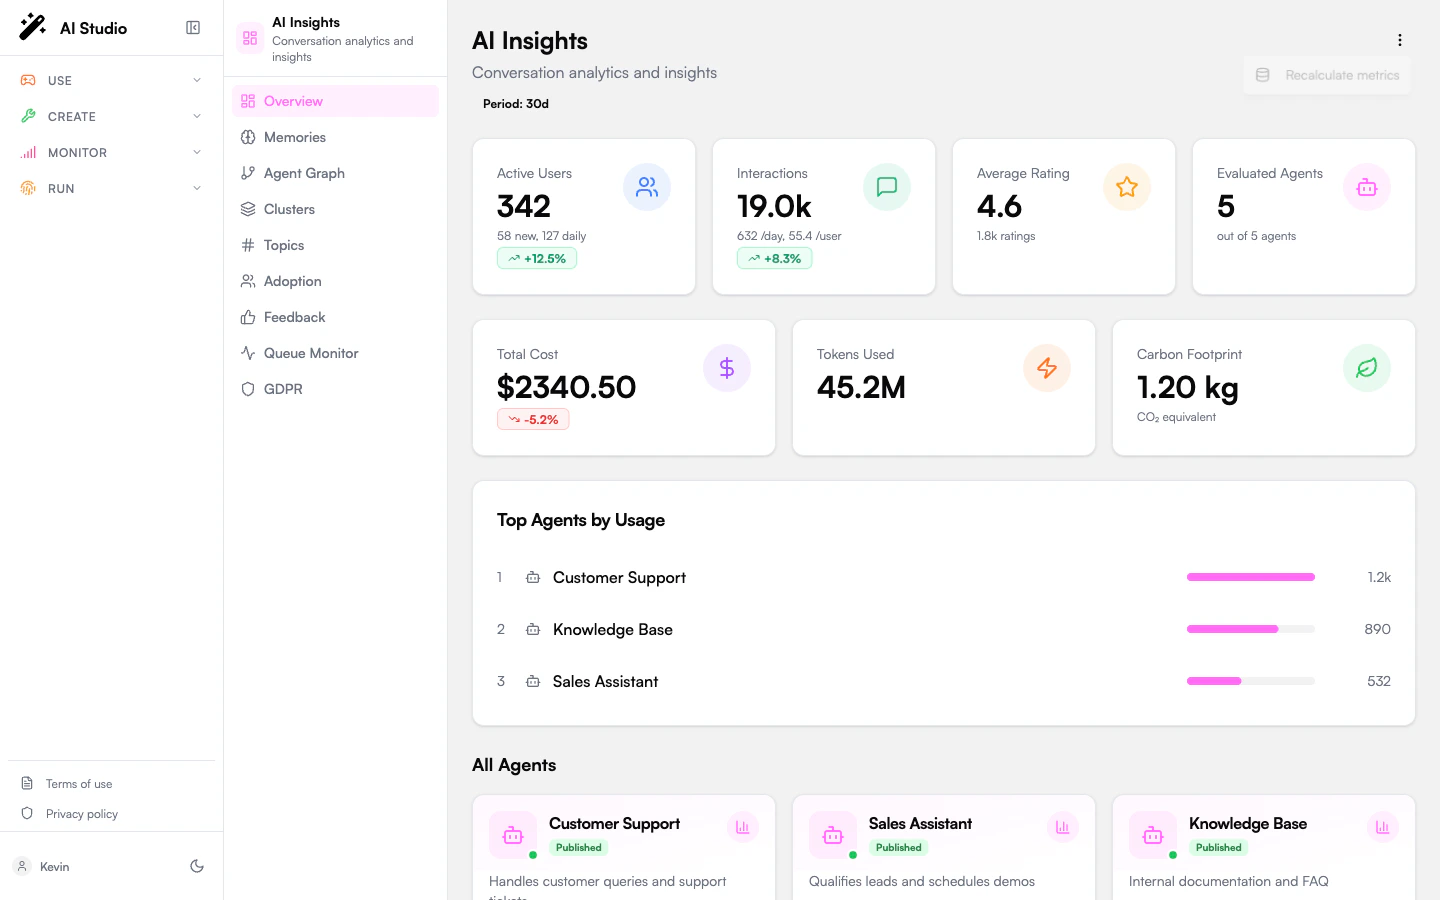
The three-dot menu in the top-right exposes **Recalculate metrics** — use it to force the rollup immediately. The action requires platform-admin authentication (verified through Governe). Without that role the request is rejected at the API layer.
## At a glance
The page has four blocks, top to bottom:
1. **Header** with the dashboard period badge and a three-dot menu.
2. **Primary KPIs** — Active Users, Interactions, Average Rating, Evaluated Agents.
3. **Secondary KPIs** — Total Cost, Tokens Used, Carbon Footprint.
4. **Top Agents by Usage** ranked list and the **All Agents** grid.
## The KPIs explained
Distinct users who interacted with at least one agent in the period. The card also shows the **new** users added in the period and the **daily** active count, plus a trend badge against the previous period of the same length.
Total user-agent interactions in the period. The card breaks it down to per-day and per-user averages, with a trend badge.
The average user rating across all rated conversations, plus the total count of ratings. A dash (`-`) means no ratings have been collected yet.
Number of agents that have at least one analyzed conversation, over the total number of published agents. A low ratio means most of your fleet is not being evaluated — likely because the agents are too new or because analysis hasn't run yet.
Aggregate model spend in the period (USD). Trends against the previous period.
Total input + output tokens across all agents in the period.
Estimated CO₂-equivalent emissions for the period in kg, derived from the model usage.
## Top Agents by Usage
The five agents with the highest interaction count, with a horizontal bar showing each agent's share of the leader's volume. Click a row to jump straight into that agent's per-agent overview.
## All Agents
A grid of every published agent your account can see. Each card surfaces the agent's name, category, and a quick read on its analyzed volume and average score. Click any card to enter the agent view.
## Recalculate metrics
The KPIs on this page are computed from a daily aggregation. After a large bulk analysis run, the dashboard may show stale numbers until the next aggregation cycle.
The three-dot menu in the top-right exposes **Recalculate metrics** — use it to force the rollup immediately. The action requires platform-admin authentication (verified through Governe). Without that role the request is rejected at the API layer.
 ## What this dashboard doesn't show
* **Per-agent quality detail.** Use [Agent overview](/products/ai-insights/agent-overview) instead.
* **User feedback.** Likes, dislikes, and dislike categories live on [Feedback](/products/ai-insights/feedback).
* **Adoption segmentation.** Power / Regular / Basic users live on [Adoption](/products/ai-insights/adoption).
* **Memory and topic trends.** See [Memories](/products/ai-insights/memories) and [Topics](/products/ai-insights/topics).
## Where to go next
Click any agent card to enter its scoped view.
See agents, tools, and categories as an interactive network.
## What this dashboard doesn't show
* **Per-agent quality detail.** Use [Agent overview](/products/ai-insights/agent-overview) instead.
* **User feedback.** Likes, dislikes, and dislike categories live on [Feedback](/products/ai-insights/feedback).
* **Adoption segmentation.** Power / Regular / Basic users live on [Adoption](/products/ai-insights/adoption).
* **Memory and topic trends.** See [Memories](/products/ai-insights/memories) and [Topics](/products/ai-insights/topics).
## Where to go next
Click any agent card to enter its scoped view.
See agents, tools, and categories as an interactive network.