> ## Documentation Index
> Fetch the complete documentation index at: https://docs.prisme.ai/llms.txt
> Use this file to discover all available pages before exploring further.
# Observability
> Monitor workspace performance, errors, costs, dependencies and a real-time event feed
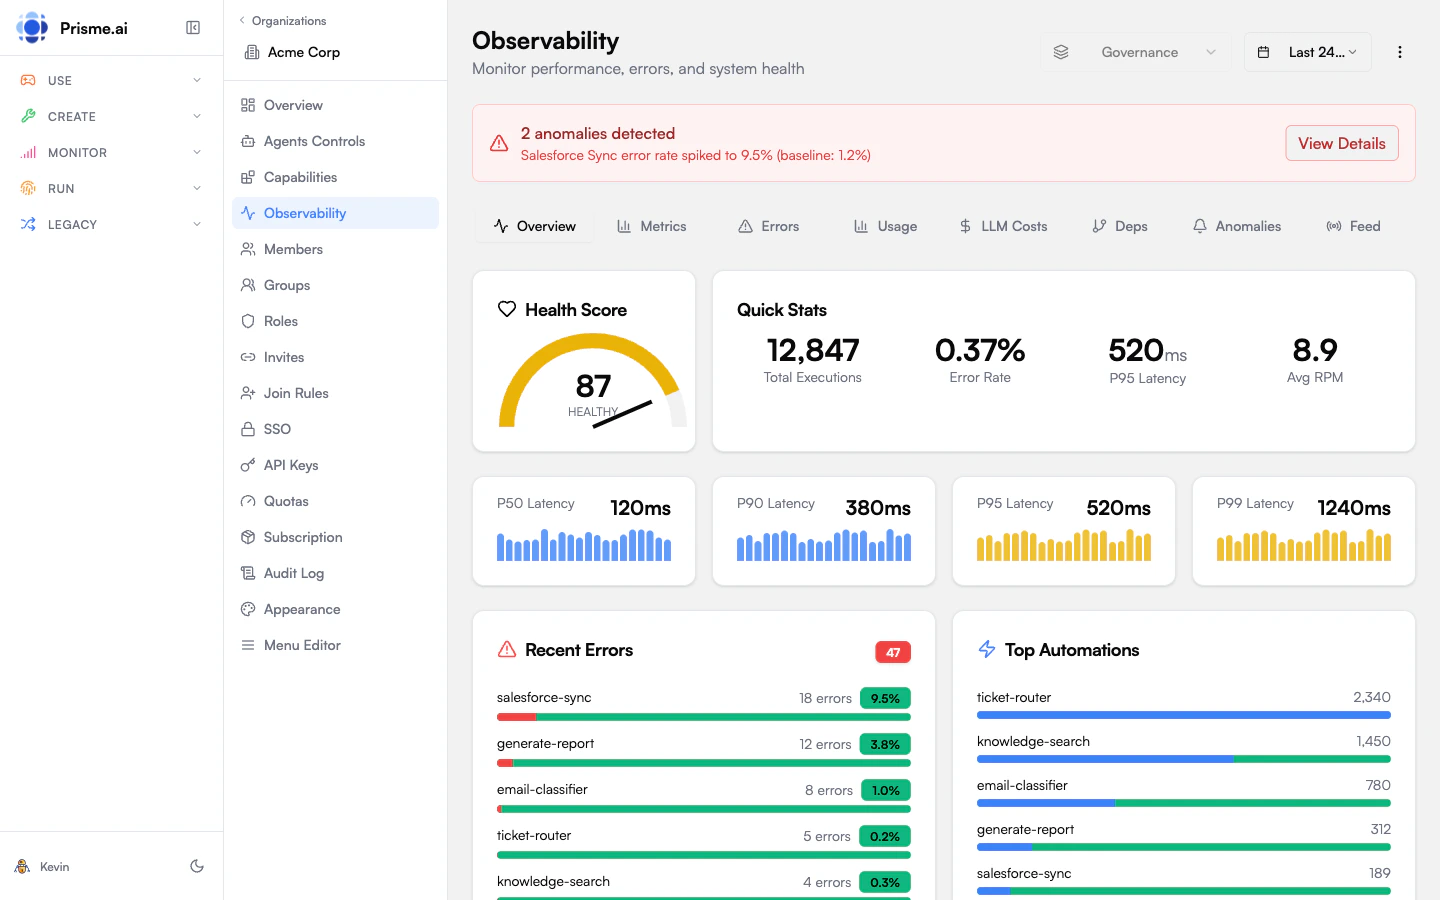 Observability gives you deep visibility into your AI workspaces: performance metrics, error rates, LLM costs, dependency graph and a real-time event feed. Open it from **Observability** in the Governance sidebar, then pick the workspace you want to inspect from the picker.
## How metrics are collected
Metrics are computed **on demand** from raw platform events. When you open the dashboard, the backend either returns a cached summary (if recent enough) or runs a single Elasticsearch aggregation across the requested period and caches the result for the next viewer.
| Source event | What it captures |
| -------------------------------- | ----------------------------------------------------------------------------------- |
| `runtime.automations.executed` | Every automation execution — duration, automation slug, app instance, trigger type |
| `runtime.interactions.triggered` | Every top-level user request — used for unique-user counts |
| `error` + `runtime.fetch.failed` | All error events — error code, automation, correlation ID, originating app instance |
| `analytics.llm.completion` | Every LLM API call — tokens, cost, model, provider, carbon |
### Granularity & cache TTL
Granularity is picked from the period length, with a couple of admissible overrides for power users (drag-to-select on a chart can lift the resolution).
| Period | Default granularity | Cache TTL | Allowed overrides |
| --------------- | ------------------- | ----------------------- | ----------------- |
| **1h** | 5-minute buckets | 5 min | hourly |
| **24h** | hourly | 15 min | — |
| **7d** | hourly | 15 min | daily |
| **30d** | daily | 1 h | — |
| **Custom ≤ 2h** | 5-minute buckets | 5 min (intervals only) | hourly |
| **Custom ≤ 7d** | hourly | 15 min (intervals only) | daily |
| **Custom > 7d** | daily | 1 h (intervals only) | — |
Two cache layers share the same TTL (the granularity's staleness):
* **Per-bucket intervals** — populated by every read, preset or custom. Custom ranges produce buckets aligned to the same granularity boundaries a preset run would, so reads of overlapping windows reuse them.
* **Summary** — populated by **preset reads only** (the cache key encodes the period name; arbitrary `start/end` pairs have no canonical key). Custom ranges always recompute the summary live; only the intervals are shared.
The current open interval is always re-aggregated on dashboard read when stale. **Custom date ranges always recompute the summary** live (the summary cache key only knows about preset period names, not arbitrary start/end pairs), but the **per-bucket intervals are cached**: a custom range writes its hourly/daily/5m rows back to the cache exactly like a preset run does, so any future read — preset or custom — that overlaps the same window reuses them. The first time you scroll back to a given custom window you pay the full ES cost; the second time you only pay the summary recompute.
A small **Live** badge in the toolbar surfaces when the response includes the current open interval. Use the **Recalculate metrics** entry in the overflow menu to force a fresh re-aggregation across the full window (e.g. when you suspect the cache is stale).
## Dashboard tabs
The dashboard is split across seven tabs (the **LLM Costs** tab is hidden when the workspace doesn't emit LLM events).
### Overview
At-a-glance snapshot of the workspace's health.
* **Health gauge** — composite 0–100 score with a status (Healthy / Degraded / Warning / Critical / Idle). See [Health score](#health-score) for the formula.
* **Quick stats** — Total Interactions, Error Rate, P95 Latency, Average RPM.
* **Latency distribution** — single card with four horizontal bars (P50, P90, P95, P99), each color-coded against the warning/danger thresholds. Bars are normalized against P99, so a tight workload shows four nearly-equal bars and a long-tail one shows P50 as a sliver with P99 maxed out.
* **Recent Errors** — automations with the highest error count in the period, each row linking to the workspace activity feed pre-filtered to the matching error events. Opening that feed requires access to the source workspace (see [access disclaimer](#cross-tab-deep-links)).
* **Top Automations** — automations ranked by execution count, with their P95 latency.
### Metrics
* **Latency percentile cards** — P50, P90, P95, P99 over the whole period.
* **Slowest Automations** — top 20 automations ranked by P95 latency. The execution-count cell on each row is a deep-link to the **Feed** tab pre-scoped to the slowest 10 correlation IDs of that automation, so you can jump straight to the actual slow calls.
* **Latency Timeline** — per-bucket P95 line chart with **interaction volume** overlaid as a second line on a right-hand axis (distinct color). Lets you tell apart load-driven latency spikes from genuine regressions at a glance. Drag-to-select on the chart to zoom into a custom range.
### Errors
* **Headline cards** — Total Interactions, Error Rate, Total Errors.
* **Error Timeline** — error-event count per bucket.
* **Errors by Type** — error codes (from `payload.error || payload.code || type`) bucketed alongside the **app instance** that emitted them. The same error code surfacing from two distinct app instances shows as two distinct rows (e.g. `FetchError · OpenAI.AWS` vs `FetchError · OpenAI.GoogleVertex`). Each row's badge deep-links to the activity feed with `source.appInstanceFullSlug` + a matching `source.appInstanceDepth`, so the activity page lands on the right nesting depth instead of defaulting to depth 0.
* **Errors by Automation** — automations sorted by error count, with computed error rate. Same activity-feed deep-link with the right app/depth filters.
The deep-link badges on both error tables navigate to the source workspace's activity feed — opening it requires access to that workspace (workspace share or superadmin). See the [access disclaimer](#cross-tab-deep-links) under Cross-tab deep links.
### Usage
* **Headline cards** — Unique Users, Total Interactions, Average per Day, Average RPM, Peak RPM.
* **Top Entrypoints** — entry-point automations (HTTP webhooks + event listeners) ranked by call count.
* **Activity Timeline** — per-bucket interactions and executions on a dual-axis chart. Drag-to-select supported.
* **Unique Users Timeline** — distinct users per bucket.
### LLM Costs
Sourced from `analytics.llm.completion` events emitted by the **llm-gateway** workspace. Hidden when the selected workspace has no LLM activity in the period.
* **Headline cards** — Total Cost, Input Tokens, Output Tokens, LLM Calls, Carbon (kg CO₂eq).
* **Cost by Model** — per-model breakdown with cost share, token count and call count.
* **Cost by Provider** — call count and average latency per provider.
* **Cost Timeline** — per-bucket cost trend.
### Dependencies
Visualises how the workspace's own automations call **installed app instances** during the period. Scope is intentionally narrow:
* Edges are filtered to **direct** workspace → app calls (`source.appInstanceDepth = 1`). Nested app → app sub-calls (depth ≥ 2) are excluded — they don't fit the workspace-vs-app matrix shape.
* Caller must be a workspace automation (`payload.trigger.type = automation`) calling an app-instance automation (`source.appInstanceFullSlug` set). Pure workspace → workspace internal calls are **not** graphed here, and app → workspace calls don't exist on the platform.
What you see:
* **Summary cards** — Total Nodes, Total Edges, Automations (distinct workspace callers), Apps (distinct app instances called).
* **Adjacency Matrix** — caller × callee matrix capped at 20×20 cells.
* Rows = workspace automations that called an app
* Columns = app-instance automations that were called (e.g. `OpenAI.chat-completion`, `models.find`)
* Cell color intensity scales with call count; hover shows the exact pair and count
* Intra-app calls (one automation in app X calling another in the same app X via dotted slug) are pruned client-side
### Feed
A near-real-time event feed for debugging and live monitoring. Bypasses the platform\_metrics cache — every refresh queries Elasticsearch directly.
**Filter row:**
* **Search** — debounced free-text search forwarded to ES `simple_query_string`.
* **Scopes** — multi-select between `interactions`, `errors`, `failed_fetches`. Defaults to all three. The `interactions` scope surfaces top-level executions (`runtime.automations.executed` filtered to entry-point trigger types) so each row carries duration metadata.
* **Min / Max duration (ms)** — restrict to executions in a duration band. Events without `payload.duration` (e.g. plain errors) won't match when set.
* **User** — typeahead combobox to filter on `source.userId`.
* **Correlation IDs chip** — appears when the URL carries a `correlationIds=` query (set by the Slowest Automations deep-link). Click to clear and broaden the view.
**Event rows** show the date (`dd/mm/yy`) + time, type badge, automation/trigger slug, optional resolved user name, optional duration pill, and a clickable arrow that opens the workspace activity feed pre-filtered to that event's correlation ID. The trace arrow leaves the Governance scope and lands on the source workspace's UI — it requires workspace access (share or superadmin), see the [access disclaimer](#cross-tab-deep-links).
## Health score
A composite 0–100 metric with a status (Healthy / Degraded / Warning / Critical / Idle). Workspaces with no interactions in the period return `null` and the status `Idle`.
### Status thresholds
| Status | Score range | Meaning |
| ------------ | ----------- | ------------------------------------------------ |
| **Healthy** | 90–100 | All good |
| **Degraded** | 70–89 | Some friction |
| **Warning** | 50–69 | Significant issues |
| **Critical** | 0–49 | Major problems |
| **Idle** | n/a | No interactions in the period — health undefined |
### Formula
```
if totalInteractions == 0:
score = null
status = "idle"
else:
errorScore = max(0, 100 - errorRate × 500) # 0% → 100, 20%+ → 0
excess = max(0, p95Ms - latency_floor_ms) # default floor: 500ms
latencyScore = max(0, 100 × (1 - excess / (latency_cap_ms - latency_floor_ms)))
score = round((errorScore × 0.7) + (latencyScore × 0.3)) # default weights: 70/30
```
`errorScore` is a linear function of error rate. `latencyScore` is **flat at 100 below `latency_floor_ms`** (any P95 ≤ floor is treated as perfect — no penalty), then declines linearly to 0 at `latency_cap_ms`.
Defaults: error 70% / latency 30%, floor 500ms, cap 5000ms, error saturation 500. All four are tunable globally via `config.health_score.*`.
### Per-workspace overrides
Some workspaces are legitimately slow — the LLM gateway baseline is around 10s because LLM completions are inherently slow. Setting a 500ms floor on it would peg the score at 0 on every read.
Per-workspace overrides live under `config.health_score.workspace_overrides.` and may set `latency_floor_ms` and/or `latency_cap_ms` independently:
```yaml theme={null}
health_score:
error_weight: 0.7
latency_weight: 0.3
latency_cap_ms: 5000
workspace_overrides:
llm-gateway:
latency_floor_ms: 10000
latency_cap_ms: 30000
```
The `(i)` tooltip next to the health gauge surfaces the active baseline.
* errorRate = 0.02 → errorScore = `100 - 0.02 × 500 = 90`
* excess = `max(0, 800 - 500) = 300` → latencyScore = `100 × (1 - 300 / 4500) = 93`
* score = `round(90 × 0.7 + 93 × 0.3) = 91` → **Healthy**
* errorRate = 0 → errorScore = 100
* 8 000ms ≤ floor (10 000ms) → latencyScore = 100
* score = 100 → **Healthy**
Same workload on a default-config workspace would give latencyScore = 0 → score = 70 → Degraded. The override matches the LLM workload reality.
## Error rate calculation
Error rate is **interaction-based**, not raw-event-based. This matters because a single user request can fan out into many automation executions:
```
errorRate = (failed_interactions / total_interactions) × 100
```
Where:
* **total\_interactions** — `value_count` of `runtime.interactions.triggered` events
* **failed\_interactions** — distinct count of `source.correlationId` across `error` and `runtime.fetch.failed` events (one interaction with multiple errors counts once)
This reflects the **user-perceived failure rate**. Dividing raw error events by automation executions would under-report failure rate by 100× when an interaction fans into many sub-executions.
## Latency percentiles
Two scopes coexist on purpose, and each tooltip in the UI makes it explicit so you don't compare apples and oranges.
| Scope | Source | Where it shows |
| --------------------- | ------------------------------------------------------------------------------------------ | -------------------------------------------------------------------------------- |
| **Interaction-level** | `runtime.automations.executed` filtered to entry-point trigger types (`endpoint`, `event`) | Overview headline + Latency Distribution, Metrics percentile cards, Health Score |
| **Per-automation** | All `runtime.automations.executed` events including sub-helpers and internal automations | Top Automations, Slowest Automations |
The interaction-level scope captures the **full lifecycle** of a user-facing request. The per-automation scope is what you want for debugging — to know which sub-helper inside an interaction is slow.
## Cross-tab deep links
The dashboard is wired together by clickable shortcuts that pre-scope other tabs to the row you came from.
| From | Click target | Lands on |
| -------------------------------- | --------------------- | ------------------------------------------------------------------------------------------------------------------------------------------------------------------------ |
| Recent Errors row | "N errors" link | Workspace activity feed, filtered to `error` + `runtime.fetch.failed` events for that automation (with the right `source.appInstanceDepth` for app-instance automations) |
| Errors by Type badge | "N (x.y%)" link | Same activity feed, filtered to that error code (text search) and originating app instance |
| Errors by Automation badge | Same as Recent Errors | — |
| Slowest Automations "calls" cell | The number itself | Feed tab pre-scoped to the slowest 10 correlation IDs of that automation, opens in a new tab |
| Feed event row | Whole row | Activity feed pre-filtered to that event's `source.correlationId` |
The activity-feed deep links use both `source.appInstanceFullSlug` and a matching `source.appInstanceDepth` so app-instance events (e.g. `OpenAI.AWS.fetchAPI`) land at the right nesting depth — the activity feed defaults to depth 0 (workspace-only events) when no override is supplied.
**Access to raw events stays bound to the source workspace's ACLs.**
Every one of these deep links navigates **out of Governance** and into the activity feed of the workspace that emitted the events. For the link to actually open, the viewer must have access to that underlying workspace — either through an explicit share (owner/editor/viewer role on that workspace) or through platform-wide **superadmin** rights, which grant access to every workspace. Without one of those, the activity-feed page will refuse to load the events even though the metrics row in Governance was visible.
This is by design — a deliberate separation of duties between observability and execution data:
* **Governance** surfaces aggregated, metric-grade information (latency, error counts, cost, dependencies, health) suitable for a platform, security or FinOps owner monitoring health and spend across many workspaces they don't otherwise operate.
* **Workspace activity feeds** expose the raw event payloads behind those metrics — user inputs, agent outputs, prompts, tool arguments, document IDs, sometimes PII. That data remains governed by the workspace's own access list.
Drilling from a metric down to the underlying events therefore stays subject to the workspace's own access rules: the metrics travel up into the Governance scope, the underlying data stays compartmentalized below it. If a Governance reviewer needs to investigate a specific incident in a workspace they don't own, the workspace owner must explicitly share access (or a superadmin must perform the drill-down on their behalf) — the link itself is not a bypass.
## Time range & filters
Top-of-page filters apply to every tab.
* **Workspace picker** — server-side searchable combobox, defaulting to the top-active workspaces ranking (refreshed daily).
* **Time range select** — 1h, 24h, 7d, 30d.
* **Custom date range** — explicit `from / to` with hour/minute precision (overrides the preset). Drag-to-select on any timeline chart fills the picker for you.
* **Live badge** — shown when the current open interval is included.
* **Recalculate metrics** — overflow menu action to force re-aggregation of the whole period (bypasses the cache for one read).
The current state of every filter is mirrored to the URL (`?period=`, `?start=`, `?end=`, `?wsId=`, `?tab=`), so dashboard URLs are shareable.
The first user opening a workspace's dashboard for a given period pays the cost of the Elasticsearch aggregation (\~1–3s typically). Subsequent users within the cache TTL get an instant response — typically tens of ms.
## Best practices
If a workspace is legitimately slow (LLM gateway, batch indexer, etc.) override `latency_floor_ms` so the score reflects reality instead of pegging at 0.
From the Metrics tab, click the calls count on a slow automation to land in the Feed already scoped to its 10 slowest calls — no manual correlation ID copy-paste.
Review the LLM Costs tab over a 7d window using the by-Model breakdown to spot expensive routings.
Use the deep-links on every error widget to land on the full event timeline (with the right app-instance depth) instead of grepping the activity feed by hand.
## Troubleshooting
1. Check **Slowest Automations** for bottlenecks
2. Click the calls cell to land on the feed scoped to the slowest correlation IDs
3. Open one of those rows in the workspace activity feed and switch to the **Timeline** or **Distribution** view (see the dedicated troubleshooting tab below) to see where the time was actually spent inside the interaction
4. Check external API response times via the **By Provider** breakdown on the LLM Costs tab
Once you've drilled down to a single correlation ID (via Slowest Automations → Feed, an error-row deep link, or the trace icon on a feed row), open it in the workspace activity feed. The activity feed offers three complementary views of the same set of events, all driven off the same `?source.correlationId=` filter:
* **Graph** — node-link diagram of the call tree. Best for understanding *which* automation called *which*, especially when an interaction fans out into many sub-helpers and apps.
* **Timeline** — waterfall chart with one bar per execution, x-axis = wall-clock time, bar length = duration. Best for spotting **where the time goes** — long bars highlight the slow steps; gaps highlight wait time between steps.
* **Distribution** — aggregated time-spent breakdown across the interaction's executions, sorted from slowest to fastest. Best for answering "which automation accounts for most of this interaction's latency?" without manually summing bars on the timeline.
Use them in combination: Graph for structure, Timeline for sequence, Distribution for the latency budget.
1. **Errors by Type** — narrow down the failure category. Same code from two apps shows as two rows so you can isolate which integration is failing.
2. **Errors by Automation** — find the automation responsible
3. Click any badge to open the activity feed already filtered to those events
4. From the activity feed, follow a correlation ID into the trace view
1. **By Model** — identify expensive models
2. **Cost Timeline** — pinpoint when the spike started
3. Cross-check against the **Top Entrypoints** on the same window — a single entrypoint dominating execution count usually points to a runaway loop
4. Check the LLM gateway workspace dashboard for upstream provider issues
1. Check the `(i)` tooltip on the gauge — it surfaces the active latency baseline
2. If the workspace is intrinsically slow (LLM gateway, batch jobs, etc.), define a per-workspace override under `config.health_score.workspace_overrides.` with a higher `latency_floor_ms`
3. Remember the score is 70% errors + 30% latency — even at perfect latency, a 20%+ error rate caps the score around 70
Common reasons:
* **Headline vs per-automation latency**: headline percentiles cover entry-point executions only (interaction-level); the Top/Slowest Automations breakdown covers all executions (including sub-helpers). They measure different populations.
* **Idle workspaces**: a workspace with no interactions in the period shows "Idle" with no health score. Expected, not a bug.
* **Cache delay**: the latest interval is refreshed when stale (5 min for 5m, 15 min hourly, 1 h daily). For real-time monitoring use the **Feed** tab.
* **Custom range vs preset**: custom ranges always recompute the summary live (the summary cache key only knows preset period names), but per-bucket intervals get cached the same way preset runs do. Repeat reads of an overlapping custom window only pay the summary recompute — not the full window. Predefined periods (1h/24h/7d/30d) cache both summary and intervals; use **Recalculate metrics** to force a fresh read.
## Next steps
Control model access and costs
Track administrative changes
Observability gives you deep visibility into your AI workspaces: performance metrics, error rates, LLM costs, dependency graph and a real-time event feed. Open it from **Observability** in the Governance sidebar, then pick the workspace you want to inspect from the picker.
## How metrics are collected
Metrics are computed **on demand** from raw platform events. When you open the dashboard, the backend either returns a cached summary (if recent enough) or runs a single Elasticsearch aggregation across the requested period and caches the result for the next viewer.
| Source event | What it captures |
| -------------------------------- | ----------------------------------------------------------------------------------- |
| `runtime.automations.executed` | Every automation execution — duration, automation slug, app instance, trigger type |
| `runtime.interactions.triggered` | Every top-level user request — used for unique-user counts |
| `error` + `runtime.fetch.failed` | All error events — error code, automation, correlation ID, originating app instance |
| `analytics.llm.completion` | Every LLM API call — tokens, cost, model, provider, carbon |
### Granularity & cache TTL
Granularity is picked from the period length, with a couple of admissible overrides for power users (drag-to-select on a chart can lift the resolution).
| Period | Default granularity | Cache TTL | Allowed overrides |
| --------------- | ------------------- | ----------------------- | ----------------- |
| **1h** | 5-minute buckets | 5 min | hourly |
| **24h** | hourly | 15 min | — |
| **7d** | hourly | 15 min | daily |
| **30d** | daily | 1 h | — |
| **Custom ≤ 2h** | 5-minute buckets | 5 min (intervals only) | hourly |
| **Custom ≤ 7d** | hourly | 15 min (intervals only) | daily |
| **Custom > 7d** | daily | 1 h (intervals only) | — |
Two cache layers share the same TTL (the granularity's staleness):
* **Per-bucket intervals** — populated by every read, preset or custom. Custom ranges produce buckets aligned to the same granularity boundaries a preset run would, so reads of overlapping windows reuse them.
* **Summary** — populated by **preset reads only** (the cache key encodes the period name; arbitrary `start/end` pairs have no canonical key). Custom ranges always recompute the summary live; only the intervals are shared.
The current open interval is always re-aggregated on dashboard read when stale. **Custom date ranges always recompute the summary** live (the summary cache key only knows about preset period names, not arbitrary start/end pairs), but the **per-bucket intervals are cached**: a custom range writes its hourly/daily/5m rows back to the cache exactly like a preset run does, so any future read — preset or custom — that overlaps the same window reuses them. The first time you scroll back to a given custom window you pay the full ES cost; the second time you only pay the summary recompute.
A small **Live** badge in the toolbar surfaces when the response includes the current open interval. Use the **Recalculate metrics** entry in the overflow menu to force a fresh re-aggregation across the full window (e.g. when you suspect the cache is stale).
## Dashboard tabs
The dashboard is split across seven tabs (the **LLM Costs** tab is hidden when the workspace doesn't emit LLM events).
### Overview
At-a-glance snapshot of the workspace's health.
* **Health gauge** — composite 0–100 score with a status (Healthy / Degraded / Warning / Critical / Idle). See [Health score](#health-score) for the formula.
* **Quick stats** — Total Interactions, Error Rate, P95 Latency, Average RPM.
* **Latency distribution** — single card with four horizontal bars (P50, P90, P95, P99), each color-coded against the warning/danger thresholds. Bars are normalized against P99, so a tight workload shows four nearly-equal bars and a long-tail one shows P50 as a sliver with P99 maxed out.
* **Recent Errors** — automations with the highest error count in the period, each row linking to the workspace activity feed pre-filtered to the matching error events. Opening that feed requires access to the source workspace (see [access disclaimer](#cross-tab-deep-links)).
* **Top Automations** — automations ranked by execution count, with their P95 latency.
### Metrics
* **Latency percentile cards** — P50, P90, P95, P99 over the whole period.
* **Slowest Automations** — top 20 automations ranked by P95 latency. The execution-count cell on each row is a deep-link to the **Feed** tab pre-scoped to the slowest 10 correlation IDs of that automation, so you can jump straight to the actual slow calls.
* **Latency Timeline** — per-bucket P95 line chart with **interaction volume** overlaid as a second line on a right-hand axis (distinct color). Lets you tell apart load-driven latency spikes from genuine regressions at a glance. Drag-to-select on the chart to zoom into a custom range.
### Errors
* **Headline cards** — Total Interactions, Error Rate, Total Errors.
* **Error Timeline** — error-event count per bucket.
* **Errors by Type** — error codes (from `payload.error || payload.code || type`) bucketed alongside the **app instance** that emitted them. The same error code surfacing from two distinct app instances shows as two distinct rows (e.g. `FetchError · OpenAI.AWS` vs `FetchError · OpenAI.GoogleVertex`). Each row's badge deep-links to the activity feed with `source.appInstanceFullSlug` + a matching `source.appInstanceDepth`, so the activity page lands on the right nesting depth instead of defaulting to depth 0.
* **Errors by Automation** — automations sorted by error count, with computed error rate. Same activity-feed deep-link with the right app/depth filters.
The deep-link badges on both error tables navigate to the source workspace's activity feed — opening it requires access to that workspace (workspace share or superadmin). See the [access disclaimer](#cross-tab-deep-links) under Cross-tab deep links.
### Usage
* **Headline cards** — Unique Users, Total Interactions, Average per Day, Average RPM, Peak RPM.
* **Top Entrypoints** — entry-point automations (HTTP webhooks + event listeners) ranked by call count.
* **Activity Timeline** — per-bucket interactions and executions on a dual-axis chart. Drag-to-select supported.
* **Unique Users Timeline** — distinct users per bucket.
### LLM Costs
Sourced from `analytics.llm.completion` events emitted by the **llm-gateway** workspace. Hidden when the selected workspace has no LLM activity in the period.
* **Headline cards** — Total Cost, Input Tokens, Output Tokens, LLM Calls, Carbon (kg CO₂eq).
* **Cost by Model** — per-model breakdown with cost share, token count and call count.
* **Cost by Provider** — call count and average latency per provider.
* **Cost Timeline** — per-bucket cost trend.
### Dependencies
Visualises how the workspace's own automations call **installed app instances** during the period. Scope is intentionally narrow:
* Edges are filtered to **direct** workspace → app calls (`source.appInstanceDepth = 1`). Nested app → app sub-calls (depth ≥ 2) are excluded — they don't fit the workspace-vs-app matrix shape.
* Caller must be a workspace automation (`payload.trigger.type = automation`) calling an app-instance automation (`source.appInstanceFullSlug` set). Pure workspace → workspace internal calls are **not** graphed here, and app → workspace calls don't exist on the platform.
What you see:
* **Summary cards** — Total Nodes, Total Edges, Automations (distinct workspace callers), Apps (distinct app instances called).
* **Adjacency Matrix** — caller × callee matrix capped at 20×20 cells.
* Rows = workspace automations that called an app
* Columns = app-instance automations that were called (e.g. `OpenAI.chat-completion`, `models.find`)
* Cell color intensity scales with call count; hover shows the exact pair and count
* Intra-app calls (one automation in app X calling another in the same app X via dotted slug) are pruned client-side
### Feed
A near-real-time event feed for debugging and live monitoring. Bypasses the platform\_metrics cache — every refresh queries Elasticsearch directly.
**Filter row:**
* **Search** — debounced free-text search forwarded to ES `simple_query_string`.
* **Scopes** — multi-select between `interactions`, `errors`, `failed_fetches`. Defaults to all three. The `interactions` scope surfaces top-level executions (`runtime.automations.executed` filtered to entry-point trigger types) so each row carries duration metadata.
* **Min / Max duration (ms)** — restrict to executions in a duration band. Events without `payload.duration` (e.g. plain errors) won't match when set.
* **User** — typeahead combobox to filter on `source.userId`.
* **Correlation IDs chip** — appears when the URL carries a `correlationIds=` query (set by the Slowest Automations deep-link). Click to clear and broaden the view.
**Event rows** show the date (`dd/mm/yy`) + time, type badge, automation/trigger slug, optional resolved user name, optional duration pill, and a clickable arrow that opens the workspace activity feed pre-filtered to that event's correlation ID. The trace arrow leaves the Governance scope and lands on the source workspace's UI — it requires workspace access (share or superadmin), see the [access disclaimer](#cross-tab-deep-links).
## Health score
A composite 0–100 metric with a status (Healthy / Degraded / Warning / Critical / Idle). Workspaces with no interactions in the period return `null` and the status `Idle`.
### Status thresholds
| Status | Score range | Meaning |
| ------------ | ----------- | ------------------------------------------------ |
| **Healthy** | 90–100 | All good |
| **Degraded** | 70–89 | Some friction |
| **Warning** | 50–69 | Significant issues |
| **Critical** | 0–49 | Major problems |
| **Idle** | n/a | No interactions in the period — health undefined |
### Formula
```
if totalInteractions == 0:
score = null
status = "idle"
else:
errorScore = max(0, 100 - errorRate × 500) # 0% → 100, 20%+ → 0
excess = max(0, p95Ms - latency_floor_ms) # default floor: 500ms
latencyScore = max(0, 100 × (1 - excess / (latency_cap_ms - latency_floor_ms)))
score = round((errorScore × 0.7) + (latencyScore × 0.3)) # default weights: 70/30
```
`errorScore` is a linear function of error rate. `latencyScore` is **flat at 100 below `latency_floor_ms`** (any P95 ≤ floor is treated as perfect — no penalty), then declines linearly to 0 at `latency_cap_ms`.
Defaults: error 70% / latency 30%, floor 500ms, cap 5000ms, error saturation 500. All four are tunable globally via `config.health_score.*`.
### Per-workspace overrides
Some workspaces are legitimately slow — the LLM gateway baseline is around 10s because LLM completions are inherently slow. Setting a 500ms floor on it would peg the score at 0 on every read.
Per-workspace overrides live under `config.health_score.workspace_overrides.` and may set `latency_floor_ms` and/or `latency_cap_ms` independently:
```yaml theme={null}
health_score:
error_weight: 0.7
latency_weight: 0.3
latency_cap_ms: 5000
workspace_overrides:
llm-gateway:
latency_floor_ms: 10000
latency_cap_ms: 30000
```
The `(i)` tooltip next to the health gauge surfaces the active baseline.
* errorRate = 0.02 → errorScore = `100 - 0.02 × 500 = 90`
* excess = `max(0, 800 - 500) = 300` → latencyScore = `100 × (1 - 300 / 4500) = 93`
* score = `round(90 × 0.7 + 93 × 0.3) = 91` → **Healthy**
* errorRate = 0 → errorScore = 100
* 8 000ms ≤ floor (10 000ms) → latencyScore = 100
* score = 100 → **Healthy**
Same workload on a default-config workspace would give latencyScore = 0 → score = 70 → Degraded. The override matches the LLM workload reality.
## Error rate calculation
Error rate is **interaction-based**, not raw-event-based. This matters because a single user request can fan out into many automation executions:
```
errorRate = (failed_interactions / total_interactions) × 100
```
Where:
* **total\_interactions** — `value_count` of `runtime.interactions.triggered` events
* **failed\_interactions** — distinct count of `source.correlationId` across `error` and `runtime.fetch.failed` events (one interaction with multiple errors counts once)
This reflects the **user-perceived failure rate**. Dividing raw error events by automation executions would under-report failure rate by 100× when an interaction fans into many sub-executions.
## Latency percentiles
Two scopes coexist on purpose, and each tooltip in the UI makes it explicit so you don't compare apples and oranges.
| Scope | Source | Where it shows |
| --------------------- | ------------------------------------------------------------------------------------------ | -------------------------------------------------------------------------------- |
| **Interaction-level** | `runtime.automations.executed` filtered to entry-point trigger types (`endpoint`, `event`) | Overview headline + Latency Distribution, Metrics percentile cards, Health Score |
| **Per-automation** | All `runtime.automations.executed` events including sub-helpers and internal automations | Top Automations, Slowest Automations |
The interaction-level scope captures the **full lifecycle** of a user-facing request. The per-automation scope is what you want for debugging — to know which sub-helper inside an interaction is slow.
## Cross-tab deep links
The dashboard is wired together by clickable shortcuts that pre-scope other tabs to the row you came from.
| From | Click target | Lands on |
| -------------------------------- | --------------------- | ------------------------------------------------------------------------------------------------------------------------------------------------------------------------ |
| Recent Errors row | "N errors" link | Workspace activity feed, filtered to `error` + `runtime.fetch.failed` events for that automation (with the right `source.appInstanceDepth` for app-instance automations) |
| Errors by Type badge | "N (x.y%)" link | Same activity feed, filtered to that error code (text search) and originating app instance |
| Errors by Automation badge | Same as Recent Errors | — |
| Slowest Automations "calls" cell | The number itself | Feed tab pre-scoped to the slowest 10 correlation IDs of that automation, opens in a new tab |
| Feed event row | Whole row | Activity feed pre-filtered to that event's `source.correlationId` |
The activity-feed deep links use both `source.appInstanceFullSlug` and a matching `source.appInstanceDepth` so app-instance events (e.g. `OpenAI.AWS.fetchAPI`) land at the right nesting depth — the activity feed defaults to depth 0 (workspace-only events) when no override is supplied.
**Access to raw events stays bound to the source workspace's ACLs.**
Every one of these deep links navigates **out of Governance** and into the activity feed of the workspace that emitted the events. For the link to actually open, the viewer must have access to that underlying workspace — either through an explicit share (owner/editor/viewer role on that workspace) or through platform-wide **superadmin** rights, which grant access to every workspace. Without one of those, the activity-feed page will refuse to load the events even though the metrics row in Governance was visible.
This is by design — a deliberate separation of duties between observability and execution data:
* **Governance** surfaces aggregated, metric-grade information (latency, error counts, cost, dependencies, health) suitable for a platform, security or FinOps owner monitoring health and spend across many workspaces they don't otherwise operate.
* **Workspace activity feeds** expose the raw event payloads behind those metrics — user inputs, agent outputs, prompts, tool arguments, document IDs, sometimes PII. That data remains governed by the workspace's own access list.
Drilling from a metric down to the underlying events therefore stays subject to the workspace's own access rules: the metrics travel up into the Governance scope, the underlying data stays compartmentalized below it. If a Governance reviewer needs to investigate a specific incident in a workspace they don't own, the workspace owner must explicitly share access (or a superadmin must perform the drill-down on their behalf) — the link itself is not a bypass.
## Time range & filters
Top-of-page filters apply to every tab.
* **Workspace picker** — server-side searchable combobox, defaulting to the top-active workspaces ranking (refreshed daily).
* **Time range select** — 1h, 24h, 7d, 30d.
* **Custom date range** — explicit `from / to` with hour/minute precision (overrides the preset). Drag-to-select on any timeline chart fills the picker for you.
* **Live badge** — shown when the current open interval is included.
* **Recalculate metrics** — overflow menu action to force re-aggregation of the whole period (bypasses the cache for one read).
The current state of every filter is mirrored to the URL (`?period=`, `?start=`, `?end=`, `?wsId=`, `?tab=`), so dashboard URLs are shareable.
The first user opening a workspace's dashboard for a given period pays the cost of the Elasticsearch aggregation (\~1–3s typically). Subsequent users within the cache TTL get an instant response — typically tens of ms.
## Best practices
If a workspace is legitimately slow (LLM gateway, batch indexer, etc.) override `latency_floor_ms` so the score reflects reality instead of pegging at 0.
From the Metrics tab, click the calls count on a slow automation to land in the Feed already scoped to its 10 slowest calls — no manual correlation ID copy-paste.
Review the LLM Costs tab over a 7d window using the by-Model breakdown to spot expensive routings.
Use the deep-links on every error widget to land on the full event timeline (with the right app-instance depth) instead of grepping the activity feed by hand.
## Troubleshooting
1. Check **Slowest Automations** for bottlenecks
2. Click the calls cell to land on the feed scoped to the slowest correlation IDs
3. Open one of those rows in the workspace activity feed and switch to the **Timeline** or **Distribution** view (see the dedicated troubleshooting tab below) to see where the time was actually spent inside the interaction
4. Check external API response times via the **By Provider** breakdown on the LLM Costs tab
Once you've drilled down to a single correlation ID (via Slowest Automations → Feed, an error-row deep link, or the trace icon on a feed row), open it in the workspace activity feed. The activity feed offers three complementary views of the same set of events, all driven off the same `?source.correlationId=` filter:
* **Graph** — node-link diagram of the call tree. Best for understanding *which* automation called *which*, especially when an interaction fans out into many sub-helpers and apps.
* **Timeline** — waterfall chart with one bar per execution, x-axis = wall-clock time, bar length = duration. Best for spotting **where the time goes** — long bars highlight the slow steps; gaps highlight wait time between steps.
* **Distribution** — aggregated time-spent breakdown across the interaction's executions, sorted from slowest to fastest. Best for answering "which automation accounts for most of this interaction's latency?" without manually summing bars on the timeline.
Use them in combination: Graph for structure, Timeline for sequence, Distribution for the latency budget.
1. **Errors by Type** — narrow down the failure category. Same code from two apps shows as two rows so you can isolate which integration is failing.
2. **Errors by Automation** — find the automation responsible
3. Click any badge to open the activity feed already filtered to those events
4. From the activity feed, follow a correlation ID into the trace view
1. **By Model** — identify expensive models
2. **Cost Timeline** — pinpoint when the spike started
3. Cross-check against the **Top Entrypoints** on the same window — a single entrypoint dominating execution count usually points to a runaway loop
4. Check the LLM gateway workspace dashboard for upstream provider issues
1. Check the `(i)` tooltip on the gauge — it surfaces the active latency baseline
2. If the workspace is intrinsically slow (LLM gateway, batch jobs, etc.), define a per-workspace override under `config.health_score.workspace_overrides.` with a higher `latency_floor_ms`
3. Remember the score is 70% errors + 30% latency — even at perfect latency, a 20%+ error rate caps the score around 70
Common reasons:
* **Headline vs per-automation latency**: headline percentiles cover entry-point executions only (interaction-level); the Top/Slowest Automations breakdown covers all executions (including sub-helpers). They measure different populations.
* **Idle workspaces**: a workspace with no interactions in the period shows "Idle" with no health score. Expected, not a bug.
* **Cache delay**: the latest interval is refreshed when stale (5 min for 5m, 15 min hourly, 1 h daily). For real-time monitoring use the **Feed** tab.
* **Custom range vs preset**: custom ranges always recompute the summary live (the summary cache key only knows preset period names), but per-bucket intervals get cached the same way preset runs do. Repeat reads of an overlapping custom window only pay the summary recompute — not the full window. Predefined periods (1h/24h/7d/30d) cache both summary and intervals; use **Recalculate metrics** to force a fresh read.
## Next steps
Control model access and costs
Track administrative changes