> ## Documentation Index
> Fetch the complete documentation index at: https://docs.prisme.ai/llms.txt
> Use this file to discover all available pages before exploring further.
# Testing & Debugging
> Validate and troubleshoot Builder applications with Activity traces and correlation IDs
When something fails in Builder, start from the execution trace. Every API request, webhook call, automation run, fetch call, emitted event, and runtime error is recorded in **Activity** with metadata that lets you reconstruct what happened.
The most important value is the correlation ID:
* API responses include it in the `x-correlation-id` response header.
* Automation test runs expose it when execution completes or fails.
* Activity events store it as `source.correlationId`.
* Filtering Activity by `source.correlationId` shows the related events for the same request or execution chain.
## Debug a failed run
Trigger the failing action from the same entry point a user uses: page action, form submit, webhook, manual automation execution, or external API call.
Keep the timestamp, workspace, user, automation slug, and input payload close at hand. These values help narrow the Activity search if the failure does not expose a correlation ID directly.
If the failing action is an API call, copy the `x-correlation-id` response header.
If the failing action is an automation test run, use the link or trace button shown after execution. Builder opens Activity with a URL filter such as:
```text theme={null}
/builder//activity?source.correlationId=
```
Go to **Activity**, click **Filter**, then add a specific field:
| Field | Value |
| ---------------------- | ------------------------- |
| `source.correlationId` | The copied correlation ID |
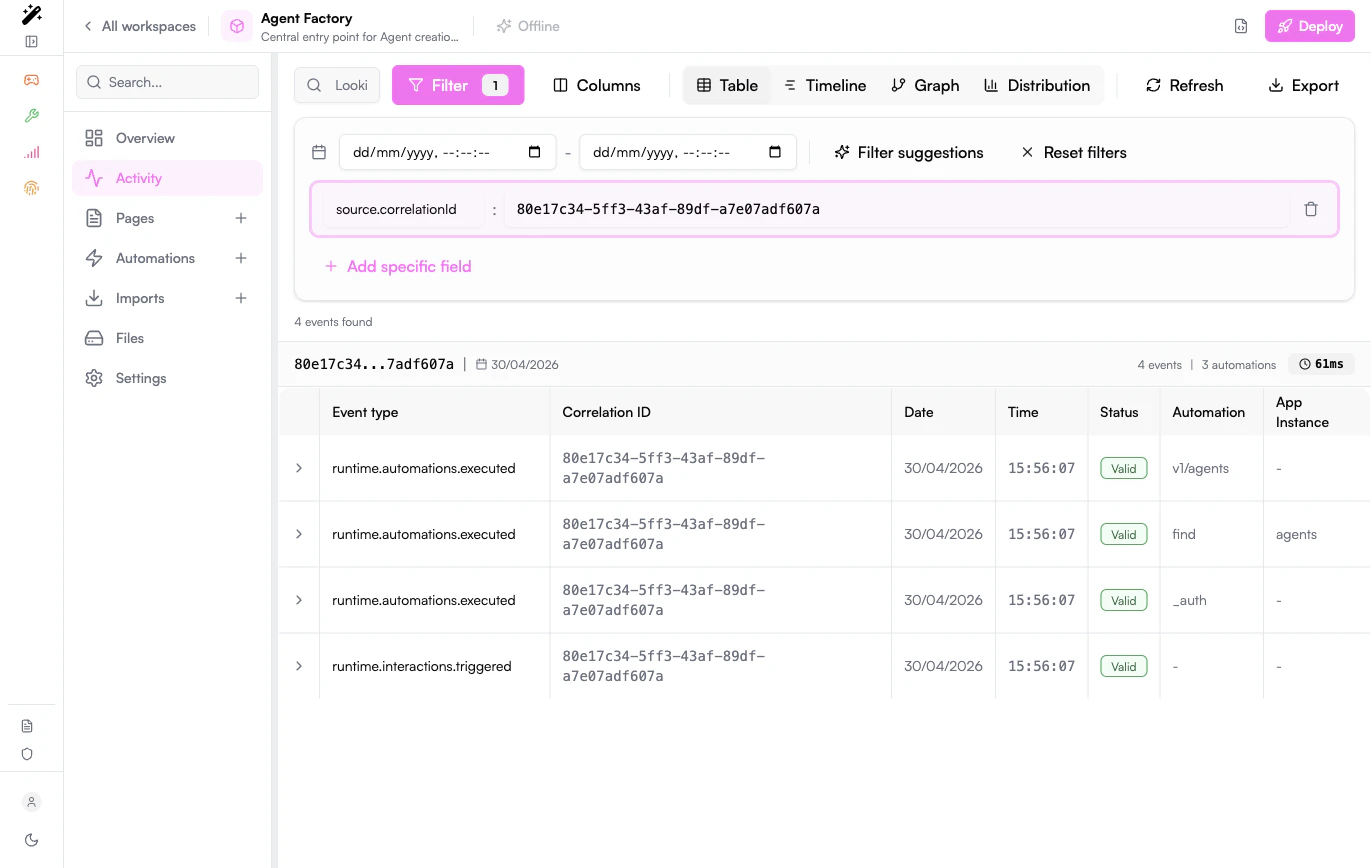
Once this filter is active, Activity unlocks trace-oriented views: **Table**, **Timeline**, **Graph**, and **Distribution**.
Start with the earliest event in the trace, then follow the sequence forward.
Look for the first event whose status is an error or whose payload contains an unexpected value. Later errors are often consequences of that first failure.
Expand the event row and check:
| Field | What it tells you |
| ---------------------------- | ------------------------------------------------------------------------------------------------------------------------------- |
| `type` | What happened, for example `runtime.interactions.triggered`, `runtime.automations.executed`, `runtime.fetch.failed`, or `error` |
| `payload` | Inputs, outputs, HTTP response data, error messages, and custom emitted data |
| `source.automationSlug` | Which automation emitted or executed the event |
| `source.appInstanceFullSlug` | Which installed app or imported app was involved |
| `source.userId` | Which user triggered the action |
| `source.sessionId` | Which browser/session triggered the action |
| `source.host.service` | Which backend service produced the event |
## Advanced Activity filters
Use advanced filters when you do not have a correlation ID yet, or when you need to compare several related failures.
Use `source.automationSlug` to focus on one automation.
Use `type` for one event type, or `types` for several exact event types.
Use `source.userId` or `source.sessionId` when debugging a user-reported issue.
Use `source.appInstanceFullSlug` when an imported app or connector is involved.
Common filters:
| Goal | Filters |
| ---------------------------- | ----------------------------------------------------------------------------- |
| Show one trace | `source.correlationId = ` |
| Show one automation | `source.automationSlug = ` |
| Show errors | `types = error,runtime.fetch.failed` |
| Show webhook calls | `type = runtime.interactions.triggered` and `payload.trigger.type = endpoint` |
| Show workspace edits | `type = workspaces.*` |
| Show events emitted by users | `source.serviceTopic = topic:runtime:emit` and `source.userId = *` |
| Show one user's activity | `source.userId = ` |
You can also click filterable values directly in the Activity table. For example, clicking a correlation ID, automation slug, user ID, or event type adds the matching filter.
## Use the trace views
Use the table for exact inspection. Expand rows to read full payloads, copy IDs, and add filters from individual cells.
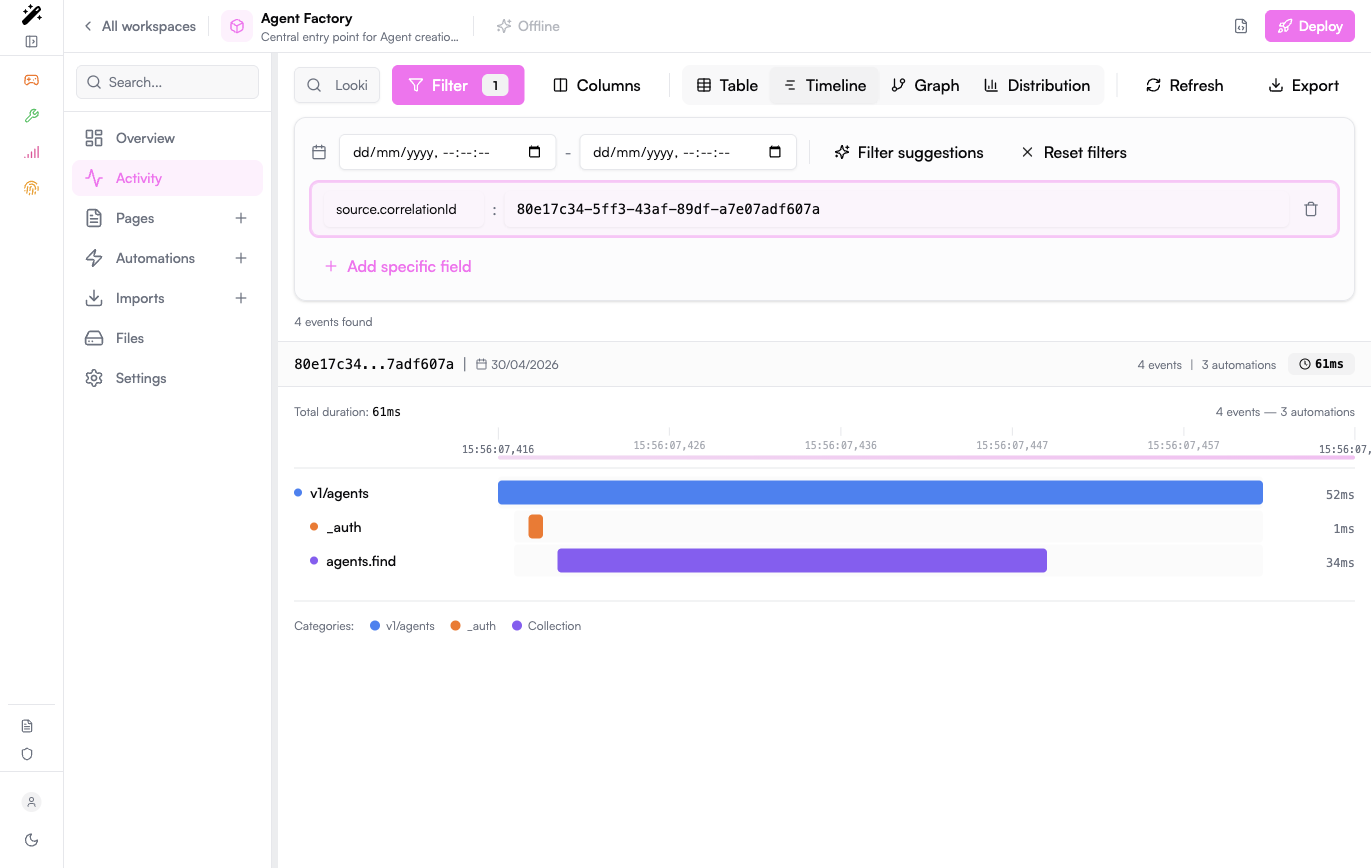
 Use the timeline to understand order. It is the fastest way to see which event happened first and how long each step took.
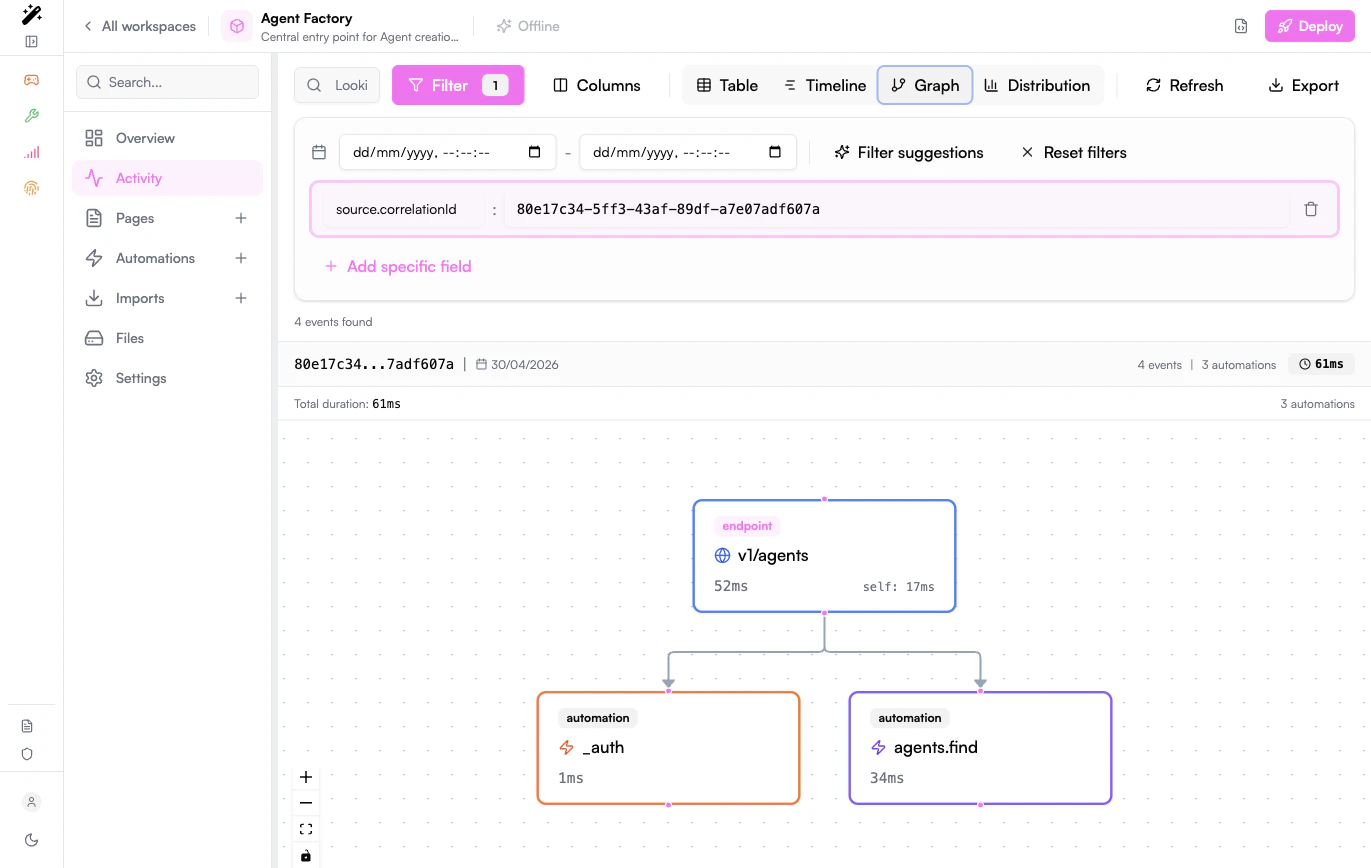
 Use the graph when several automations, imports, or app calls are involved. It helps identify the branch where the trace diverged.
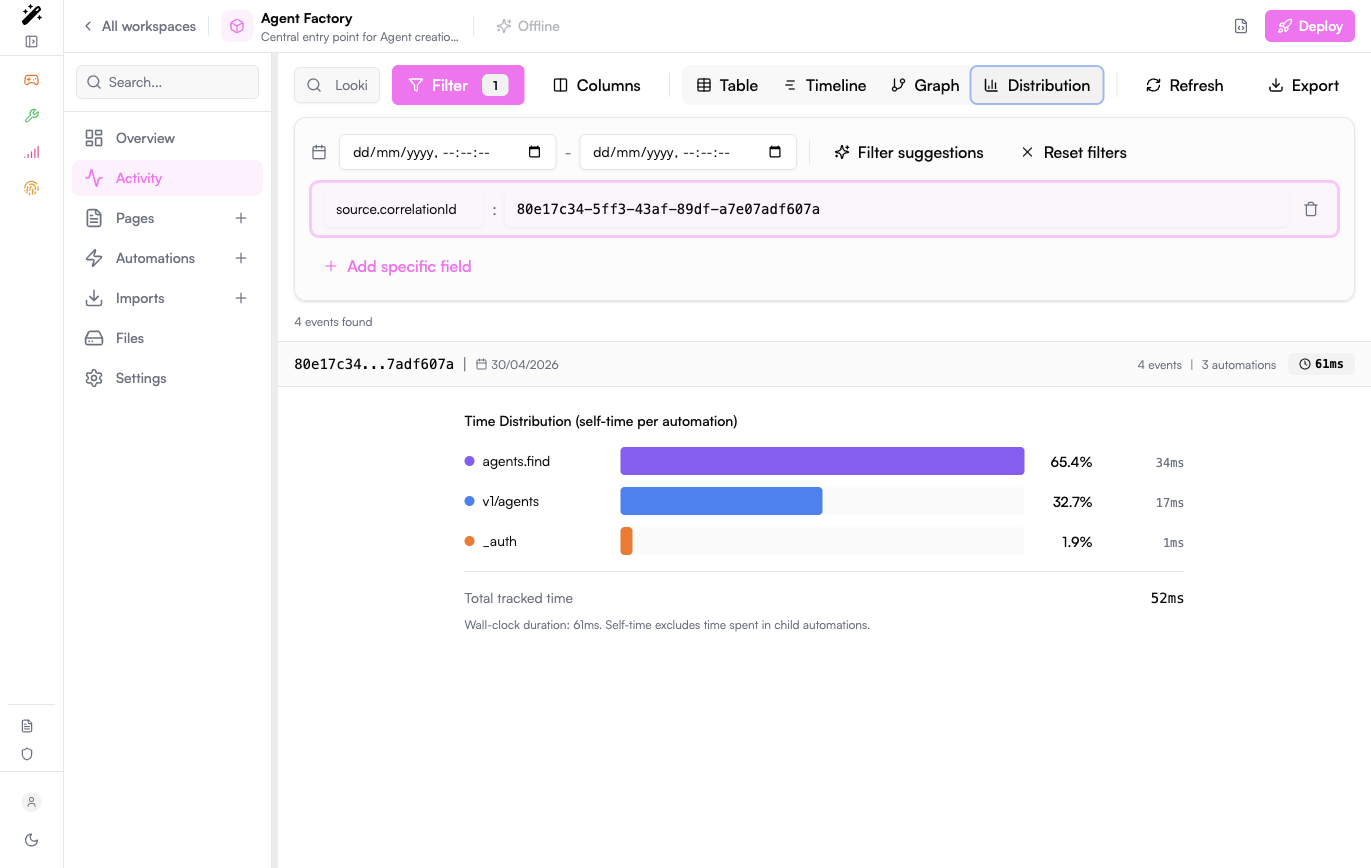
 Use distribution to spot latency spikes inside one trace. It helps separate functional errors from slow external dependencies.
 ## Add useful debug events
For complex automations, emit a small diagnostic event before and after risky steps. Keep the payload structured and avoid logging secrets, access tokens, full documents, or personal data that is not needed for debugging.
```yaml theme={null}
- emit:
event: order.debug.before-enrichment
payload:
orderId: '{{payload.orderId}}'
customerType: '{{payload.customerType}}'
step: before-enrichment
- try:
do:
- CRM.enrichCustomer:
customerId: '{{payload.customerId}}'
output: enrichedCustomer
catch:
- emit:
event: order.debug.enrichment-failed
payload:
orderId: '{{payload.orderId}}'
customerId: '{{payload.customerId}}'
error: '{{$error}}'
- set:
name: payload.error
value: '{{$error}}'
```
Good debug events are:
* **Specific**: event names describe the step, for example `invoice.debug.payment-failed`.
* **Small**: payloads contain only identifiers and the values needed to understand the branch.
* **Searchable**: use stable field names such as `orderId`, `ticketId`, `agentId`, or `externalRequestId`.
* **Safe**: secrets, tokens, raw credentials, and unnecessary personal data are never emitted.
## Test automations
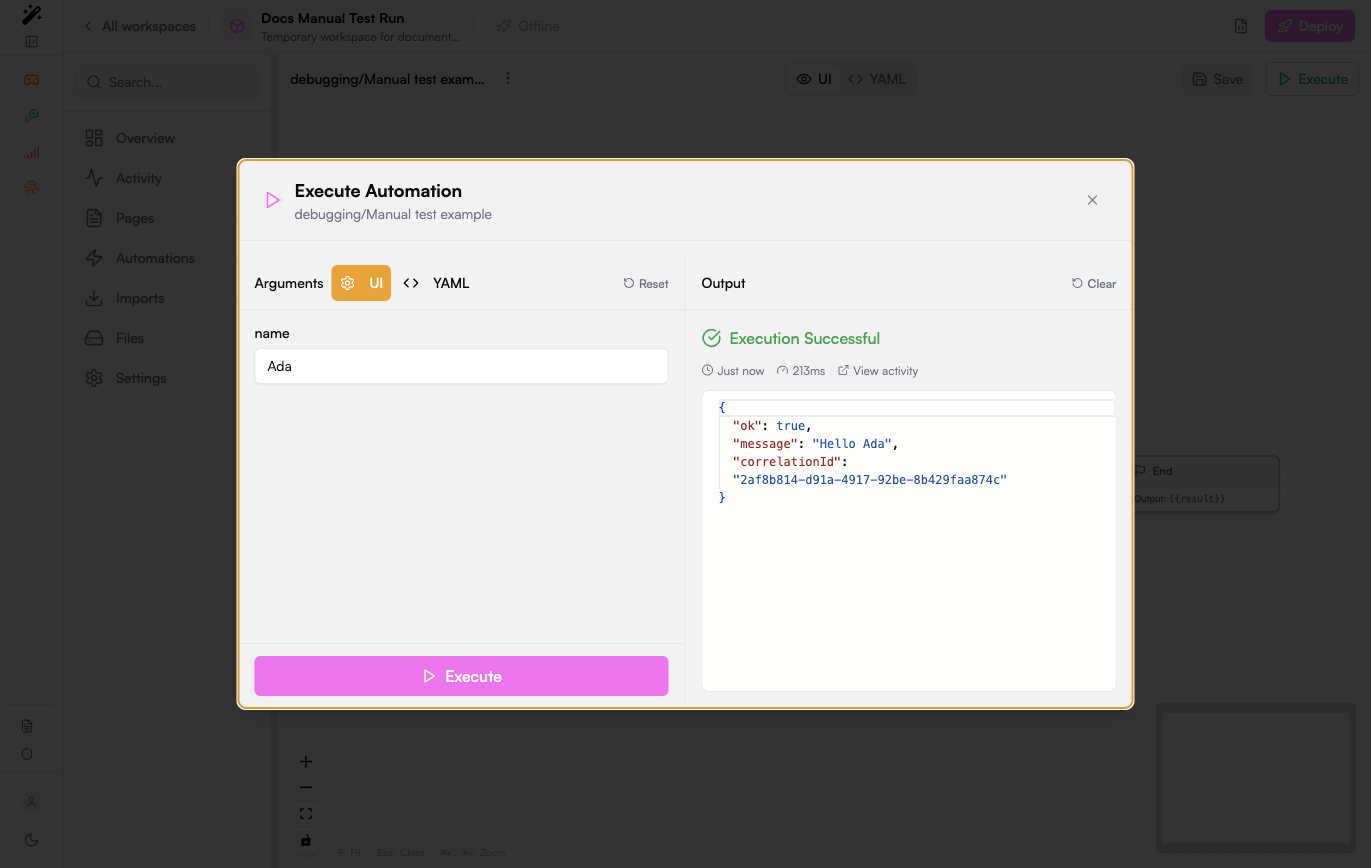
### Manual test run
Use manual execution while building or fixing an automation:
1. Open the automation.
2. Run it with the smallest payload that reproduces the behavior.
3. Check the output and the generated correlation ID.
4. Open Activity from the execution result.
5. Fix the first failing event, then run the same payload again.
## Add useful debug events
For complex automations, emit a small diagnostic event before and after risky steps. Keep the payload structured and avoid logging secrets, access tokens, full documents, or personal data that is not needed for debugging.
```yaml theme={null}
- emit:
event: order.debug.before-enrichment
payload:
orderId: '{{payload.orderId}}'
customerType: '{{payload.customerType}}'
step: before-enrichment
- try:
do:
- CRM.enrichCustomer:
customerId: '{{payload.customerId}}'
output: enrichedCustomer
catch:
- emit:
event: order.debug.enrichment-failed
payload:
orderId: '{{payload.orderId}}'
customerId: '{{payload.customerId}}'
error: '{{$error}}'
- set:
name: payload.error
value: '{{$error}}'
```
Good debug events are:
* **Specific**: event names describe the step, for example `invoice.debug.payment-failed`.
* **Small**: payloads contain only identifiers and the values needed to understand the branch.
* **Searchable**: use stable field names such as `orderId`, `ticketId`, `agentId`, or `externalRequestId`.
* **Safe**: secrets, tokens, raw credentials, and unnecessary personal data are never emitted.
## Test automations
### Manual test run
Use manual execution while building or fixing an automation:
1. Open the automation.
2. Run it with the smallest payload that reproduces the behavior.
3. Check the output and the generated correlation ID.
4. Open Activity from the execution result.
5. Fix the first failing event, then run the same payload again.
 ### API or webhook test
Use an HTTP client when the automation is exposed as a webhook or called by another system:
```bash theme={null}
curl -i -X POST "$PRISME_API_URL/v2/workspaces/$WORKSPACE_ID/webhooks/$AUTOMATION_SLUG" \
-H "Authorization: Bearer $PRISME_TOKEN" \
-H "Content-Type: application/json" \
-d '{"example": true}'
```
Copy the `x-correlation-id` response header from the HTTP response and use it in Activity.
### Regression test
Before changing a production automation, keep a small set of representative inputs:
| Scenario | What to verify |
| --------------------- | --------------------------------------------------------------------------------- |
| Happy path | The automation returns the expected output and emits the expected business event |
| Missing optional data | The automation uses defaults or skips optional steps |
| Invalid input | The automation returns a clear error and does not trigger downstream side effects |
| External API failure | The automation enters the `catch` path and emits a diagnostic event |
| Permission boundary | A user without access cannot call or modify protected resources |
## Test pages and UI actions
When debugging a page, separate UI state problems from backend execution problems.
Trigger the button, form, table action, or page event and confirm that Activity receives the expected event.
Inspect the Activity payload and confirm the page emitted the expected values.
Filter by `source.correlationId` to confirm the event reached the right automation and returned the expected output.
If the backend output is correct but the page does not update, inspect the React state, event handlers, and response handling code.
## Troubleshooting patterns
| Symptom | First checks |
| ------------------------- | ---------------------------------------------------------------------------------------------------------------------------------- |
| Automation does not start | Confirm `when.events`, `when.endpoint`, or schedule configuration; filter Activity by `runtime.interactions.triggered` |
| Webhook returns an error | Copy `x-correlation-id`, filter Activity, inspect the first `error` or `runtime.fetch.failed` event |
| External API call fails | Check URL, method, headers, secret values, response status, and timeout in the failing event payload |
| Page action does nothing | Confirm the page emits the expected event or calls the expected endpoint, and that an automation listens to that exact entry point |
| Events appear duplicated | Check whether multiple automations listen to the same event or whether the UI action emits more than once |
| Trace is too noisy | Add `source.correlationId`, `source.automationSlug`, `type`, or date range filters |
| Performance is slow | Use Timeline or Distribution and look for long fetch calls or downstream automation chains |
## Performance checks
For load or latency testing, keep the test focused on one stable entry point and always preserve correlation IDs from failed responses.
```javascript theme={null}
import http from 'k6/http';
import { check, sleep } from 'k6';
export const options = {
stages: [
{ duration: '2m', target: 20 },
{ duration: '5m', target: 20 },
{ duration: '1m', target: 0 },
],
thresholds: {
http_req_failed: ['rate<0.01'],
http_req_duration: ['p(95)<1500'],
},
};
export default function () {
const response = http.post(
`${__ENV.PRISME_API_URL}/v2/workspaces/${__ENV.WORKSPACE_ID}/webhooks/${__ENV.AUTOMATION_SLUG}`,
JSON.stringify({ example: true }),
{
headers: {
Authorization: `Bearer ${__ENV.PRISME_TOKEN}`,
'Content-Type': 'application/json',
},
}
);
check(response, {
'request succeeded': (r) => r.status >= 200 && r.status < 300,
});
if (response.status >= 400) {
console.error('correlationId=', response.headers['X-Correlation-Id']);
}
sleep(1);
}
```
After the test, investigate slow or failed requests by filtering Activity with the captured correlation IDs.
## Before escalating
Collect the following before asking another team or Prisme.ai support to investigate:
* Workspace ID or slug.
* Automation slug or page involved.
* Exact timestamp and timezone.
* Correlation ID, preferably from `x-correlation-id` or `source.correlationId`.
* Minimal input payload that reproduces the issue.
* Expected behavior and actual behavior.
* Relevant Activity export if the trace contains no sensitive data.
With those details, support can jump directly to the same trace instead of trying to infer the failing request from screenshots or approximate timestamps.
### API or webhook test
Use an HTTP client when the automation is exposed as a webhook or called by another system:
```bash theme={null}
curl -i -X POST "$PRISME_API_URL/v2/workspaces/$WORKSPACE_ID/webhooks/$AUTOMATION_SLUG" \
-H "Authorization: Bearer $PRISME_TOKEN" \
-H "Content-Type: application/json" \
-d '{"example": true}'
```
Copy the `x-correlation-id` response header from the HTTP response and use it in Activity.
### Regression test
Before changing a production automation, keep a small set of representative inputs:
| Scenario | What to verify |
| --------------------- | --------------------------------------------------------------------------------- |
| Happy path | The automation returns the expected output and emits the expected business event |
| Missing optional data | The automation uses defaults or skips optional steps |
| Invalid input | The automation returns a clear error and does not trigger downstream side effects |
| External API failure | The automation enters the `catch` path and emits a diagnostic event |
| Permission boundary | A user without access cannot call or modify protected resources |
## Test pages and UI actions
When debugging a page, separate UI state problems from backend execution problems.
Trigger the button, form, table action, or page event and confirm that Activity receives the expected event.
Inspect the Activity payload and confirm the page emitted the expected values.
Filter by `source.correlationId` to confirm the event reached the right automation and returned the expected output.
If the backend output is correct but the page does not update, inspect the React state, event handlers, and response handling code.
## Troubleshooting patterns
| Symptom | First checks |
| ------------------------- | ---------------------------------------------------------------------------------------------------------------------------------- |
| Automation does not start | Confirm `when.events`, `when.endpoint`, or schedule configuration; filter Activity by `runtime.interactions.triggered` |
| Webhook returns an error | Copy `x-correlation-id`, filter Activity, inspect the first `error` or `runtime.fetch.failed` event |
| External API call fails | Check URL, method, headers, secret values, response status, and timeout in the failing event payload |
| Page action does nothing | Confirm the page emits the expected event or calls the expected endpoint, and that an automation listens to that exact entry point |
| Events appear duplicated | Check whether multiple automations listen to the same event or whether the UI action emits more than once |
| Trace is too noisy | Add `source.correlationId`, `source.automationSlug`, `type`, or date range filters |
| Performance is slow | Use Timeline or Distribution and look for long fetch calls or downstream automation chains |
## Performance checks
For load or latency testing, keep the test focused on one stable entry point and always preserve correlation IDs from failed responses.
```javascript theme={null}
import http from 'k6/http';
import { check, sleep } from 'k6';
export const options = {
stages: [
{ duration: '2m', target: 20 },
{ duration: '5m', target: 20 },
{ duration: '1m', target: 0 },
],
thresholds: {
http_req_failed: ['rate<0.01'],
http_req_duration: ['p(95)<1500'],
},
};
export default function () {
const response = http.post(
`${__ENV.PRISME_API_URL}/v2/workspaces/${__ENV.WORKSPACE_ID}/webhooks/${__ENV.AUTOMATION_SLUG}`,
JSON.stringify({ example: true }),
{
headers: {
Authorization: `Bearer ${__ENV.PRISME_TOKEN}`,
'Content-Type': 'application/json',
},
}
);
check(response, {
'request succeeded': (r) => r.status >= 200 && r.status < 300,
});
if (response.status >= 400) {
console.error('correlationId=', response.headers['X-Correlation-Id']);
}
sleep(1);
}
```
After the test, investigate slow or failed requests by filtering Activity with the captured correlation IDs.
## Before escalating
Collect the following before asking another team or Prisme.ai support to investigate:
* Workspace ID or slug.
* Automation slug or page involved.
* Exact timestamp and timezone.
* Correlation ID, preferably from `x-correlation-id` or `source.correlationId`.
* Minimal input payload that reproduces the issue.
* Expected behavior and actual behavior.
* Relevant Activity export if the trace contains no sensitive data.
With those details, support can jump directly to the same trace instead of trying to infer the failing request from screenshots or approximate timestamps.